Navigating the CoursEval Platform
To access MyCoursEval, be sure you follow the UMSL link and use your SSOID to sign into MyCoursEval. Here, students can take surveys and instructors can access reports for their course surveys.
The following document contains all the different features that can be accessed through MyCoursEval. Some features are not accessible to certain users based on their role as a student, faculty, or department administrator.
After a student logs into MyCoursEval, if they have surveys to take, they will be placed on the My Surveys landing page. Students will be able to see surveys available to them. By clicking on a survey they have not completed, they will be able to take that survey for that course. Under the Surveys tab, students can also see available surveys, surveys they completed, and surveys they missed. They will not be able to retake previously completed surveys nor will they be able to take surveys that they missed.
After a faculty logs into MyCoursEval, if they are directly affiliated with a recent course, they will be placed on the My Reports landing page.
Faculty will be able to view the Reports tab in their MyCoursEval. Under this tab, faculty will be able to view four types of reports: Recent reports, Evaluation reports, Individual reports, and Survey Intelligence reports.
Recent reports are Evaluation reports within the most recent survey cycle. Evaluation reports are the preferred view of evaluations. Individual reports are a snapshot in time of the same data that appears in the Evaluation reports. Survey Intelligence reports are for viewing longitudinal data and for creating custom views of scaled data questions.
Please see the Reports section below for information on running reports.
Business Support Personnel, Department Chairs, and College Deans all have access to department- and college-wide reports.
After you log in to MyCoursEval you will be placed on one of four landing pages.
- If you have surveys to take, you will see the My Surveys page
- If you are directly affiliated with a recent course, you will see the My Reports page.
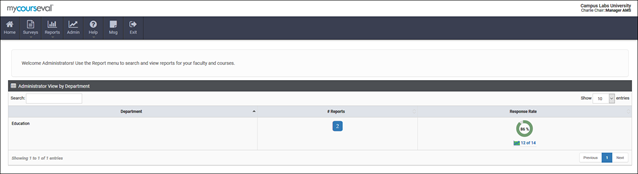
- If you are only affiliated with courses based on relationships with instructors, you will be placed on the Administrator View by Department for the specific courses you have access to.
- If you are affiliated with courses in your departments, you will see the Administrator View by Department page below.
You can switch between Surveys, Reports, and Administrator Reports using the menu options in the upper left-hand corner.
Department administrators will be able to view the Reports tab in their MyCoursEval. Under this tab, administrators will be able to view four types of reports: Recent reports, Evaluation reports, Individual reports, and Survey Intelligence reports.
Recent reports are Evaluation reports within the most recent survey cycle. Evaluation reports are the preferred view of evaluations. Individual reports are a snapshot in time of the same data that appears in the Evaluation reports. Survey Intelligence reports are for viewing longitudinal data and for creating custom views of scaled data questions.
Please see the Reports section below for information on running reports.
Report Options
Who can access reports for End-of-Course Feedback surveys? Faculty can view their reports for all of the courses they teach. Department administrators (business support personnel, department chairs, and college deans) can view reports for the classes they teach and reports for faculty within their department/college.
Who can access reports for Mid-Semester Feedback surveys? Mid-Semester Feedback is entirely optional and non-evaluative, meaning only participating faculty can see the results. Department administrators cannot view results or request access.
Additional information on interpreting and making use of student feedback on your reports can be found on our Making Sense of Student Feedback page.
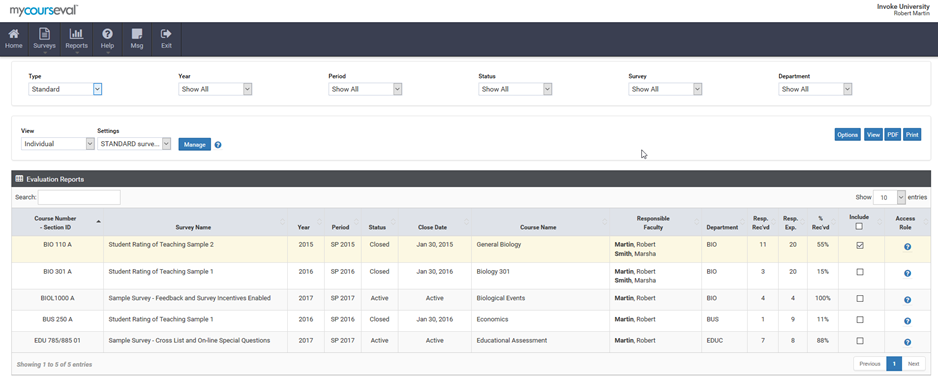
This screen displays the faculty list for the year, term, and survey selected in the drop-down menus. To view the results for a different set of surveys, change the selections from the drop-down menus and allow the screen to refresh.
There are two basic types of Evaluation Report views: Comparative and Individual. Select the type of report to view from the drop-down list labeled View.
- Comparative view: presents an overview of the performance of all individuals evaluated for each course.
- Individual view: presents the performance of each person assessed in separate sections of the report.
There are also advanced Evaluation Report views that are an extension of the Individual View.
- Individual (All): presents a drop-down filter at the top of the screen of the survey name and each individual is shown in the course/faculty list as a choice.
- Individual (Students): presents a drop-down filter at the top of the screen of each individual student evaluated for each course. This allows the user to view reports for all surveys that the student has results for by a student name.
- Individual (Faculty): presents a drop-down filter at the top of the screen of each individual faculty evaluated for each course. This allows the user to view reports for all surveys that the faculty has results for by a faculty member's name
From this page, select one or more courses to view in the report. To view the report, check the box corresponding to the report and click View.
The default report view provides numerical results obtained for the selected course(s). If more than one course is selected from the reports page, they will be displayed in sequence scrolling down the page.
The default report provides comparative results for a course and other courses in the department included in the evaluation period. Basic statistics are provided as well.
Reports may be printed by clicking the Print option located on the Evaluation Reports page or PDF can be created by clicking on the PDF option.

This report focuses on individual performance and displays the faculty list for the year, term and survey selected in the drop-down menus.
To view the results for a different set of surveys, change the selections from the drop-down menus and allow the screen to refresh.
There are two types of reports available for each course:
- Overall: About the course
- Individual: About the specific faculty listed
Click on the small graph button associated with the Individual Report to view the report.
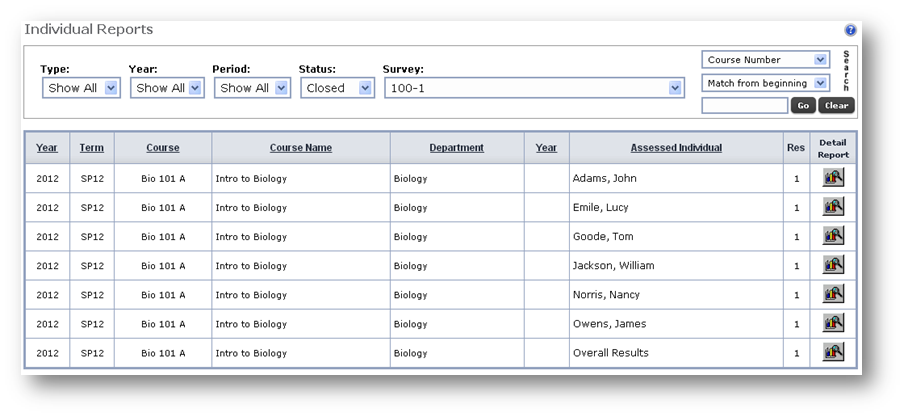
The Overall Results Screen shows the evaluation results that pertain specifically to the listed course.
The Assessed Individual Result Screen shows evaluation results that pertain specifically to the selected Instructor(s).
The purpose of this document is to guide faculty users through the process of creating Survey Intelligence Report Reports. SI reports are created using a 7-step setup that allows for various filtering, aggregating, ordering, layout/display options, and saving/publishing features. It is recommended that users have a clear goal in mind when designing reports so they can enjoy the feature’s full potential.
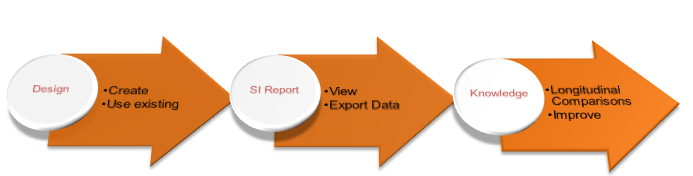
- Create or Select a Design
- Set the filters
- Select the surveys
- Choose the questions
- Setup data aggregations
- Design the layout
- Save the design
- View the report, save to PDF, or export the data to Excel
Filters
- Choose from survey attributes (period, type, focus), course attributes (number, type, year, department), people attributes (username, last name, roles), and/or rotation attributes (blocks and sites/groups).
- Not sure? Just set the close date and move on.
- Use the free-text search features to look for things… the search needs two (2) characters. Use the Add button to look for more than one item at the same time!
Surveys
- Choose the surveys to include in the report
- Not sure which surveys are which?
- Use the option to check them all!
Questions
- This part is easy! Select the questions needed in the report.
- If duplicate questions show in the list, choose them all. CoursEval will combine “duplicate” looking questions on the final report so they all show in one neat column.
Aggregations
- Use the mover to select the items to appear in the report. The order on the right is the order items that will be sorted on the report.
- NOTE - If you don't have access to people-based questions the Evaluated Individual aggregation will not work for you.
Report Options a.k.a. Report Layout
- Set the report, select the sections to appear, and choose the options.
- Do the questions have many scales? Should the data be combined into a single score? If yes, choose the overall score scale to level the scores.
- Try all of the options to get the report that is needed.
Run
- Run the report or export it to Excel.
- Reports can be run before saving the design... Saving the design is optional! In fact, if no changes were made to an existing design there is no need to save at all.
Save
- Save personal designs or save someone else’s design as your own. Just enter the name you would like and save your design for later.