UMSL's Teaching Effectiveness Taskforce recommended and sought approval from Academic Affairs and UMSL's Faculty Senate to roll out a new end-of-course student feedback survey facilitated by the Center for Teaching and Learning. All UMSL courses were transitioned to using the new survey for Fall 2023 and beyond. The material on this page will introduce you to the feedback report format for the new survey and provide you with a few useful strategies to keep in mind as you wade through your students' feedback from the surveys.
Note on End-of-Course Feedback vs. mid-semester feedback:
End-of-course student feedback is required for all courses. Results are read thoroughly by instructors, department chairpersons, associate deans, Deans, and university administrators and are included in annual reviews of faculty.
Mid-semester student feedback is optional. Only courses whose instructors opted in to solicit feedback from students at the mid-point of the semester will receive an invitation to complete this survey. This survey is also non-evaluative, meaning only the instructor can see the results. Instructors opt into mid-semester feedback for various reasons, including making course modifications or adjustments based on how the course is going or gaining insights to aid in the professional development of their teaching.
Take a deep breath! The feedback you get on these reports does not define your effectiveness as an educator. There is valuable information that you can take away from these feedback reports, however, it can be challenging to see or acknowledge that in the first reading of the report. It is helpful to collect your own thoughts on how the course went before diving into and wading through student opinions.
What do you think worked particularly well this semester?
Comparing your own perceptions of the course to what your students identify as the successes and challenges of the course can be very valuable. Areas where your perceptions may not match those of your students are key areas to consider prior to the next iteration of the course.
Consider reviewing some of these self-reflection resources if you are interested in guiding your own self-reflection.
Your end-of-course student feedback survey results are available three days after final grades are due for the semester; optional mid-semester feedback survey results are available one day after that survey closes. You will receive an email with a link to view your student feedback results. Additionally, you can visit MyCoursEval anytime to access past reports or to review your most recent feedback.
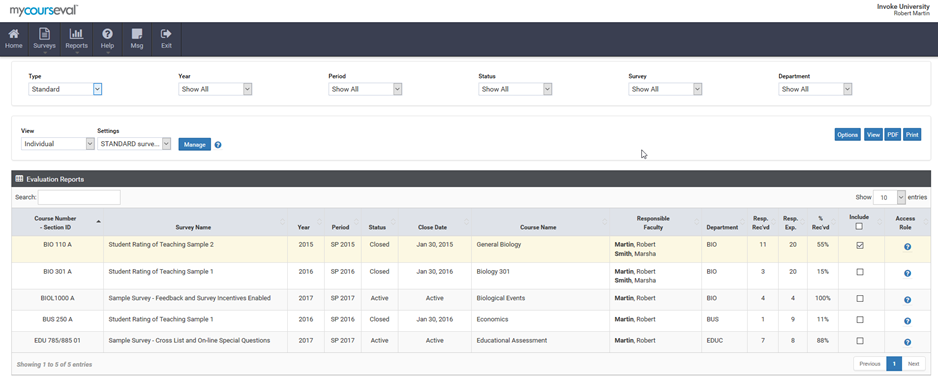
When you log into CoursEval, your most recent reports will be displayed. If you do not have any recent reports, you can select "Evaluation Reports" and use the filter options at the top to navigate to the report you are interested in viewing. You will then have the option to view any reports or download them as a PDF. Finally, you can click on the check boxes next to multiple reports to combine them into a single PDF.
The most common way to view your student feedback is the Evaluation Report, which is the format we will focus on here. However, Course Section Reports are an alternative way to view the same information as the evaluation report. Course Section Reports include a visual representation of the distribution of multiple-choice responses. This version is best viewed in the web browser, whereas Evaluation Reports can be downloaded as PDFs more easily. For more detailed information on available report formats, see the CoursEval System Resources page.
When you open your report, you should first direct your attention to the number of students who completed the survey. In the fictional example, we see that 30 out of 43 students completed the evaluation for the Environmental Science course. This is a response rate of nearly 70%. The higher the percentage of respondents, the better! If your response rate is low with only a few students completing the survey, consider using some of these tips to increase the response rate for future semesters.
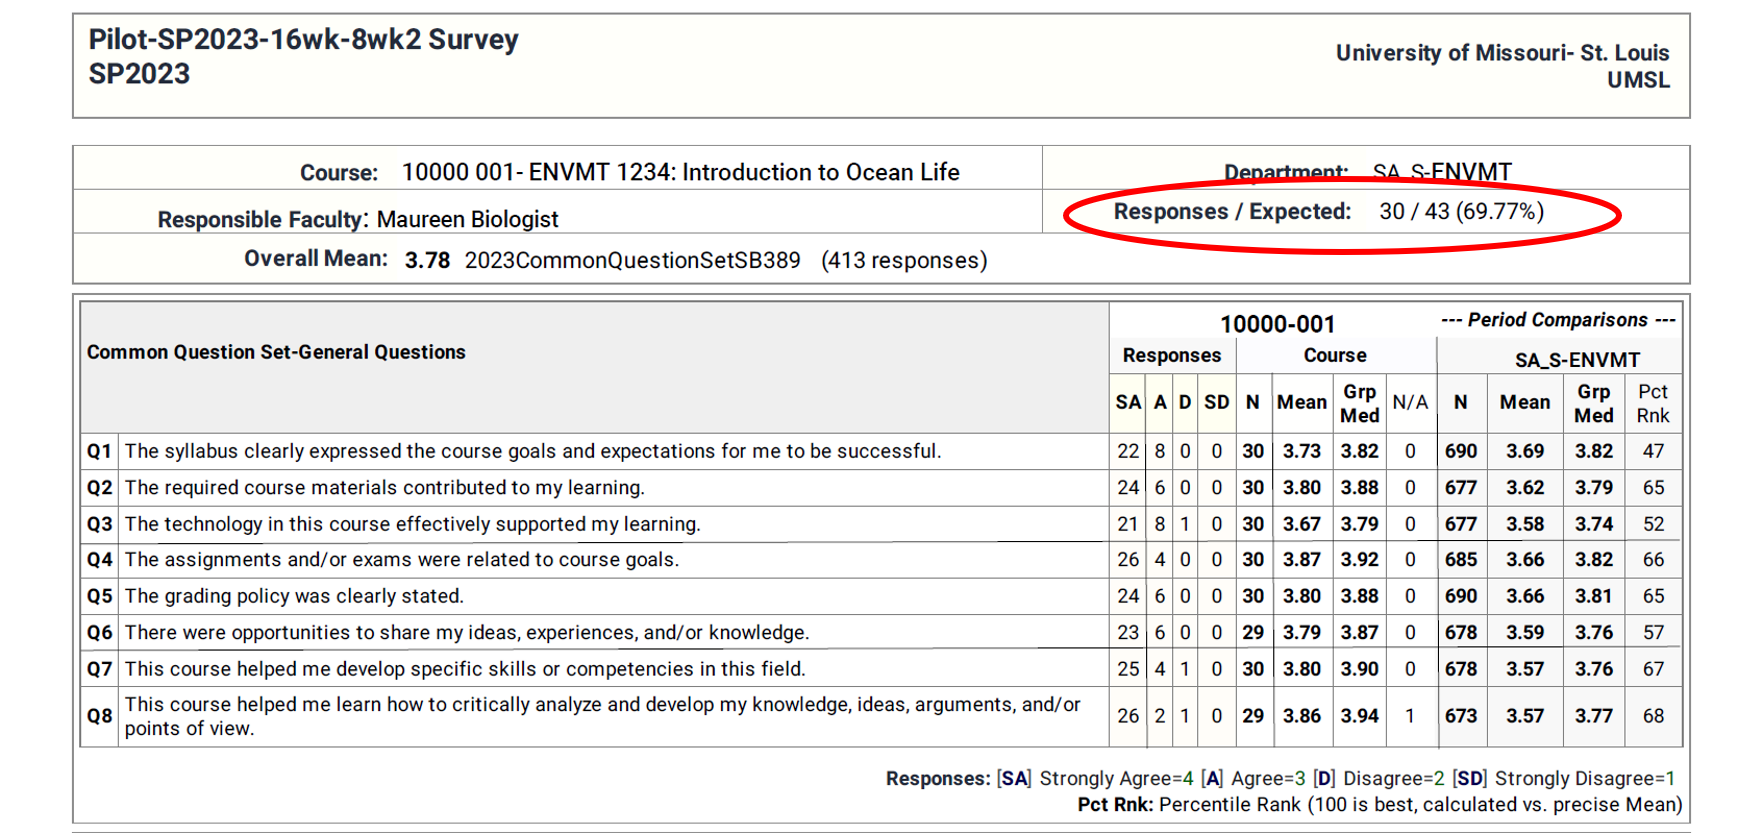
Other information listed at the top of the report includes your overall mean. This is simply the mean score of all the multiple-choice questions combined throughout the survey. This is not an overall instructor rating value. In the fictional example for ENVMT 1234, the mean score is 3.78. This is the overall mean of the 413 student responses from the 14 multiple-choice questions on the survey. Note that this value is slightly lower than the expected value of 420 student responses (30 students x 14 questions). If a student chooses N/A as a response or a student leaves a question blank making no selection, those responses do not contribute to the overall mean, therefore the total number of responses may be lower than expected.
Be careful when interpreting the overall mean score! Student feedback on multiple-choice questions tends to be skewed towards positive responses. A few negative outliers, especially if the survey has a low response rate, can have a large impact on the overall mean. It is helpful to look at specific questions and consider the median or the distribution of responses rather than the mean.
You may notice that your reports have a slightly different scale than some of your pre-2022 student feedback reports. During the pilot phase of the common question set, several issues emerged from the use of a 6-point scale (Strongly Agree, Agree, Somewhat Agree, Somewhat Disagree, Disagree, Strongly Disagree). If your department participated in the pilot during the summer or fall of 2022, or during the first half of spring 2023, your survey results will use a 6-point scale (and an NA option). Spring 2023 8 wk 2 and full semester courses transitioned to a 4-point scale (Strongly Agree, Agree, Disagree, Strongly Disagree) with an option to mark N/A or no opinion. No opinion or N/A responses are not factored into the mean or median of the responses.
All courses starting in Fall 2023 will make use of the 4-point scale with an N/A or No opinion option. A change in the scale or the questions used in the surveys may be concerning if you are preparing materials for promotion or tenure or trying to demonstrate a pattern of excellent teaching. We encourage you to visit our Impact of a Changing Student Feedback Scale page to learn more about how to interpret results amidst a scale change.
Look for patterns in the data of multiple-choice questions. Consider the distribution of student responses and focus on areas where students agree or where there may be large variation in student feedback.
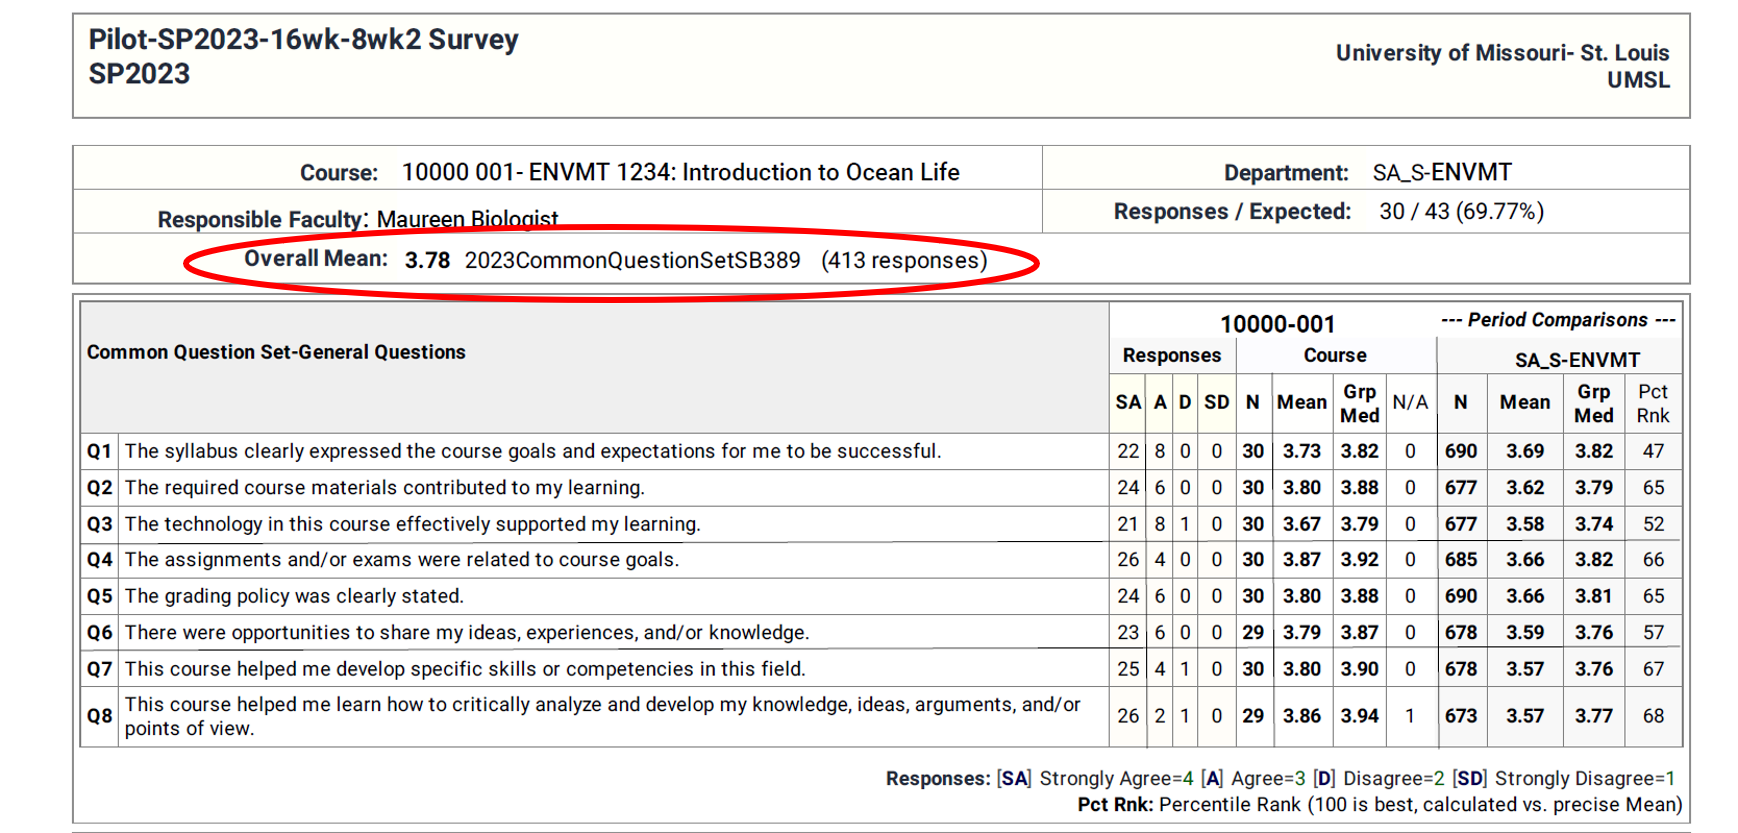
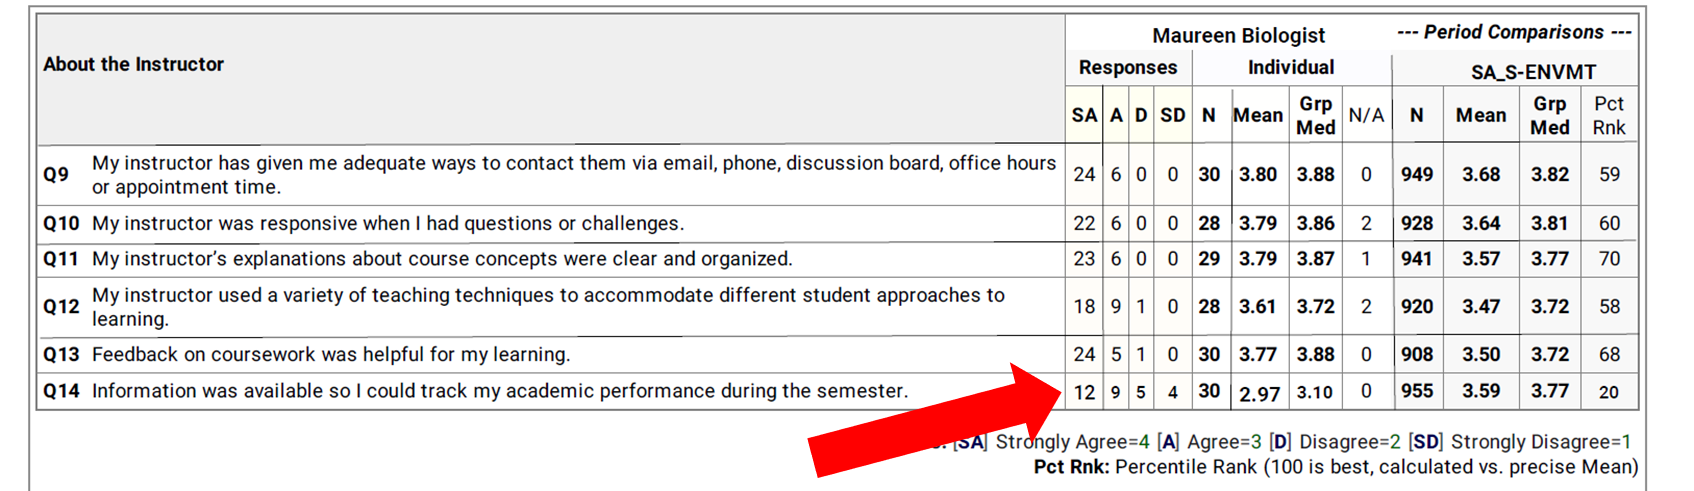
The new common question set has three groupings of questions: questions 1-5 are “About the Course”, Qs 6-8 are “About my Learning”, and questions 9-14 are “About the Instructor”. Your report may look slightly different if your department used its own survey instrument. Reminder: as of Fall 2023 all departments, colleges, and schools are using the new survey instrument.
The description of the question scoring appears at the bottom of each box, where Strongly Agree receives a value of 4 and Strongly Disagree a value of 1. The responses chart shows you the number of students that responded with each multiple-choice option. Additionally, the Period Comparisons box indicates the total number of all students in the course's department that completed an evaluation during that survey period (ie: Fall 16-week, or Spring 8-Week-I) and the average and median score for those questions across all surveys completed in the department.
A note about context: Remember that the context and characteristics of your course that are out of your control may impact the feedback you receive. If you are teaching a large enrollment, required course, you are likely to see lower ratings on student feedback reports than those teaching small, elective courses. Are you a woman? A minority? Is your class at 8:00 am? All of these factors have been shown to impact student ratings.
Proceed with caution!
The Percent Rank (PCT RNK) column is listed last in the Period Comparisons box. This value is very challenging to interpret. We caution against using this as a point of comparison. For documentation on how this value is calculated, you can see the CoursEval explanation here. For example, Q9 in the ENVMT 1234 survey report had a mean score of 3.80, which is larger than the group mean of 3.68. However, the percentile rank for Q9 is only 59. In this fictional example for ENVMT 1234, although the mean scores for Qs 9-13 are all well above the group mean, all of the percentile ranks are in the 60-70 range. Given this value does not represent what it appears to on the surface, you may find it more helpful to look to the median or distribution of responses.

Consider the distribution of responses
When reviewing the feedback from students on multiple-choice questions, it might be helpful to look at the range of the student feedback (the distribution). This is sometimes more meaningful than the overall mean. In the case of fictional ENVMT 1234, all students but 1 in the “About the Course” section (from the first report image in this section) responded with Agree, or Strongly Agree. This is helpful to know that students generally agreed that the syllabus, materials, technology, and assignments supported their learning.
Additionally, it is more helpful to look at overall patterns in multiple-choice responses as opposed to fixating on the one or two students who perhaps marked Strongly Disagree for all questions. For instance, 100% of students marked Agree, or Strongly Agree for questions 9-13 in the “About the Instructor” section. The overall pattern emphasizes that the instructor was responsive when students had questions, they explained course concepts clearly, and they used a variety of teaching techniques. However, Q14 seems to break the overall pattern with an increase in the number of students who Disagree or Strongly Disagree with the statement. This may indicate that our fictional course instructor, Maureen should spend time reviewing the ways for students to access their grades during the semester or consult with colleagues in her department or the CTL about ways to provide feedback to students on their academic performance.
It is more challenging to wade through student feedback on open-ended questions. It has been our experience that despite the numerous positive responses you receive on these questions, the one or two negative comments will be what stand out and linger in your thoughts. Although they may sting a bit, the negative comments could potentially offer you valuable feedback to improve your course. Or, they could be biased responses from disgruntled students that don’t reflect the experience of other students in the course. Determining the difference is a challenge!
After your first pass at reading through the open-ended responses, you should disregard any inappropriate, personal, or biased feedback from students. Despite our best efforts to alert students to potential bias in these surveys and to minimize opportunities for students to include these types of comments, you may encounter negative or hurtful responses. Do your best to ignore these, as hard as it can be. If egregious, please notify the CTL or your department chair. Next, you will want to organize the responses into broad categories.
Organize student responses into categories
There are many ways to approach categorizing student responses. Here we highlight two different approaches, but find what works best for you. Highlighting comments by category or rearranging them on a separate document can make this easier and allow you to look for patterns in student responses.
Organize by tone
Positive comments can be motivating and highlight aspects of the course that are working well for students. These comments are great for keeping you motivated!
Negative comments may reflect some aspect of your teaching or course design that students struggled with. For these comments, determine if the criticism is valid or if it simply reflects a student’s preference or misconception about the course. Are there student comments that reflect the opposite of this criticism? (Student A: I loved the added videos, they were very helpful, Student B: I hated the additional videos, they were a waste of time). Was the criticism from one student alone or did several students have a similar comment? Negative comments from several students that represent a valid concern about the course would be an ideal starting point when revising your course. Finally, there may be negative comments about something outside your control. Comments about an 8:00 am class time or issues with the textbook, when you might not have the ability to choose the class times or books, can be challenging. You may want to share these comments with your department chair or reference them in future discussions.
Organize by categories
Alternatively, you could categorize the feedback by the content of the comment: Perhaps you set 3 categories:
- comments about the content or course materials
- comments about the course design or policies
- comments about your teaching, approach, or support
Color code the student feedback by each category. Are there consistent opinions within each of these categories? Are there patterns that emerge? Focus on areas where there is consistent feedback (either positive or negative). Areas where there are split opinions you should consider more carefully. These may reflect simple differences in student preferences, or they may indicate areas that confused the students and could use further consideration.
Examining the comments in each category may give you ideas about what worked particularly well in your course or areas that created confusion for students. This may be another place to look when revisiting the structure, content, or approach to teaching your course.
An example
These are all comments that have been received in end-of-course student feedback surveys over the years by a member of the CTL:
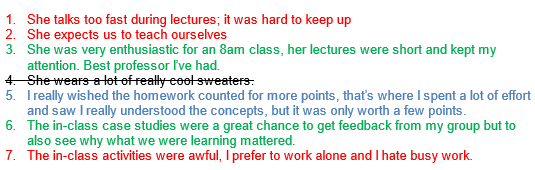 These comments are coded by tone, with those in red reflecting negative comments, green positive comments, blue neutral comments, and one comment that was personal and unhelpful. Although the faculty member received more negative comments than positive ones, several are actionable items that provided specific areas that could be addressed before teaching the course again. Here is an example excerpt from the faculty member's reflection on the comments:
Comment 1: "I have always acknowledged I’m a fast talker, so this was a valid criticism. I will explore ways to slow down my pace when I do deliver lectures, one way may be to add in intentional stop points into my lecture slides."
Comment 2: "Although a negative comment, I do in fact expect my students to take responsibility for their learning in my courses. This is a common student criticism of student-centered teaching and active learning, which has been shown to improve student retention of knowledge. Although negative in tone, this is a central theme of my own teaching philosophy. The only change I may consider in regards to this comment is to perhaps spend more time framing and emphasizing my goals for the course to students."
Comment 3: "I may have printed out the last part of this comment and put it on my bulletin board for a little pick me up on tough days!"
Comment 5: "I marked this as a neutral comment. I think this is actually one of the more helpful comments because it shows a student reflected on what was helping their learning most. The grading structure of the course didn't incentive completing the homework though so I understand the student's frustration. When revising my course, I will consider how I might change the point distribution to address this concern."
"Comments 6 and 7 reflect opposite student opinions about group work. This is another topic that can often divide the class. I am in a STEM field, collaboration is critical for success and our work is rarely done in isolation, so although I may consider how to keep group work equitable and might consider seeking out professional development opportunities around active learning and student collaboration, I will retain this component of my course moving forward. Comment 7 also indicates to me that I need to do a better job communicating with my students about why I have them do certain assignments in certain ways. I might consider researching the TILT (Transparency In Learning and Teaching) model and seeking out a consultation with the CTL on how to incorporate this into my course."
Feeling overwhelmed trying to make sense of your student feedback report? Schedule an appointment with the CTL and we can help you interpret and make sense of your feedback. Studies have shown that consulting with others about your feedback can improve your scores in subsequent courses!