A note about Standard Deviation and using Median over Mean:
Evaluation Reports contain a standard deviation (SD) number. Standard deviation is a measure of how much the values in a set of data vary from the average. It shows whether the data points are generally close to the average or spread out over a wider range. A low standard deviation means the values are clustered tightly around the average, indicating consistency. A high standard deviation means the values are more spread out, showing greater variability.
Survey Intelligence Reports allow users to have the system average by median or mean. We encourage users to select Median over mean because it may represent a clearer and fairer picture, especially when the data includes outliers or unusual results; for example, certain contextual items that are outside of a person's control. The mean can be easily skewed by one or two very high or very low scores, which might not accurately reflect typical performance. The Median represents the middle value in a set of numbers, so it's less affected by extremes.
Survey Intelligence Report Example
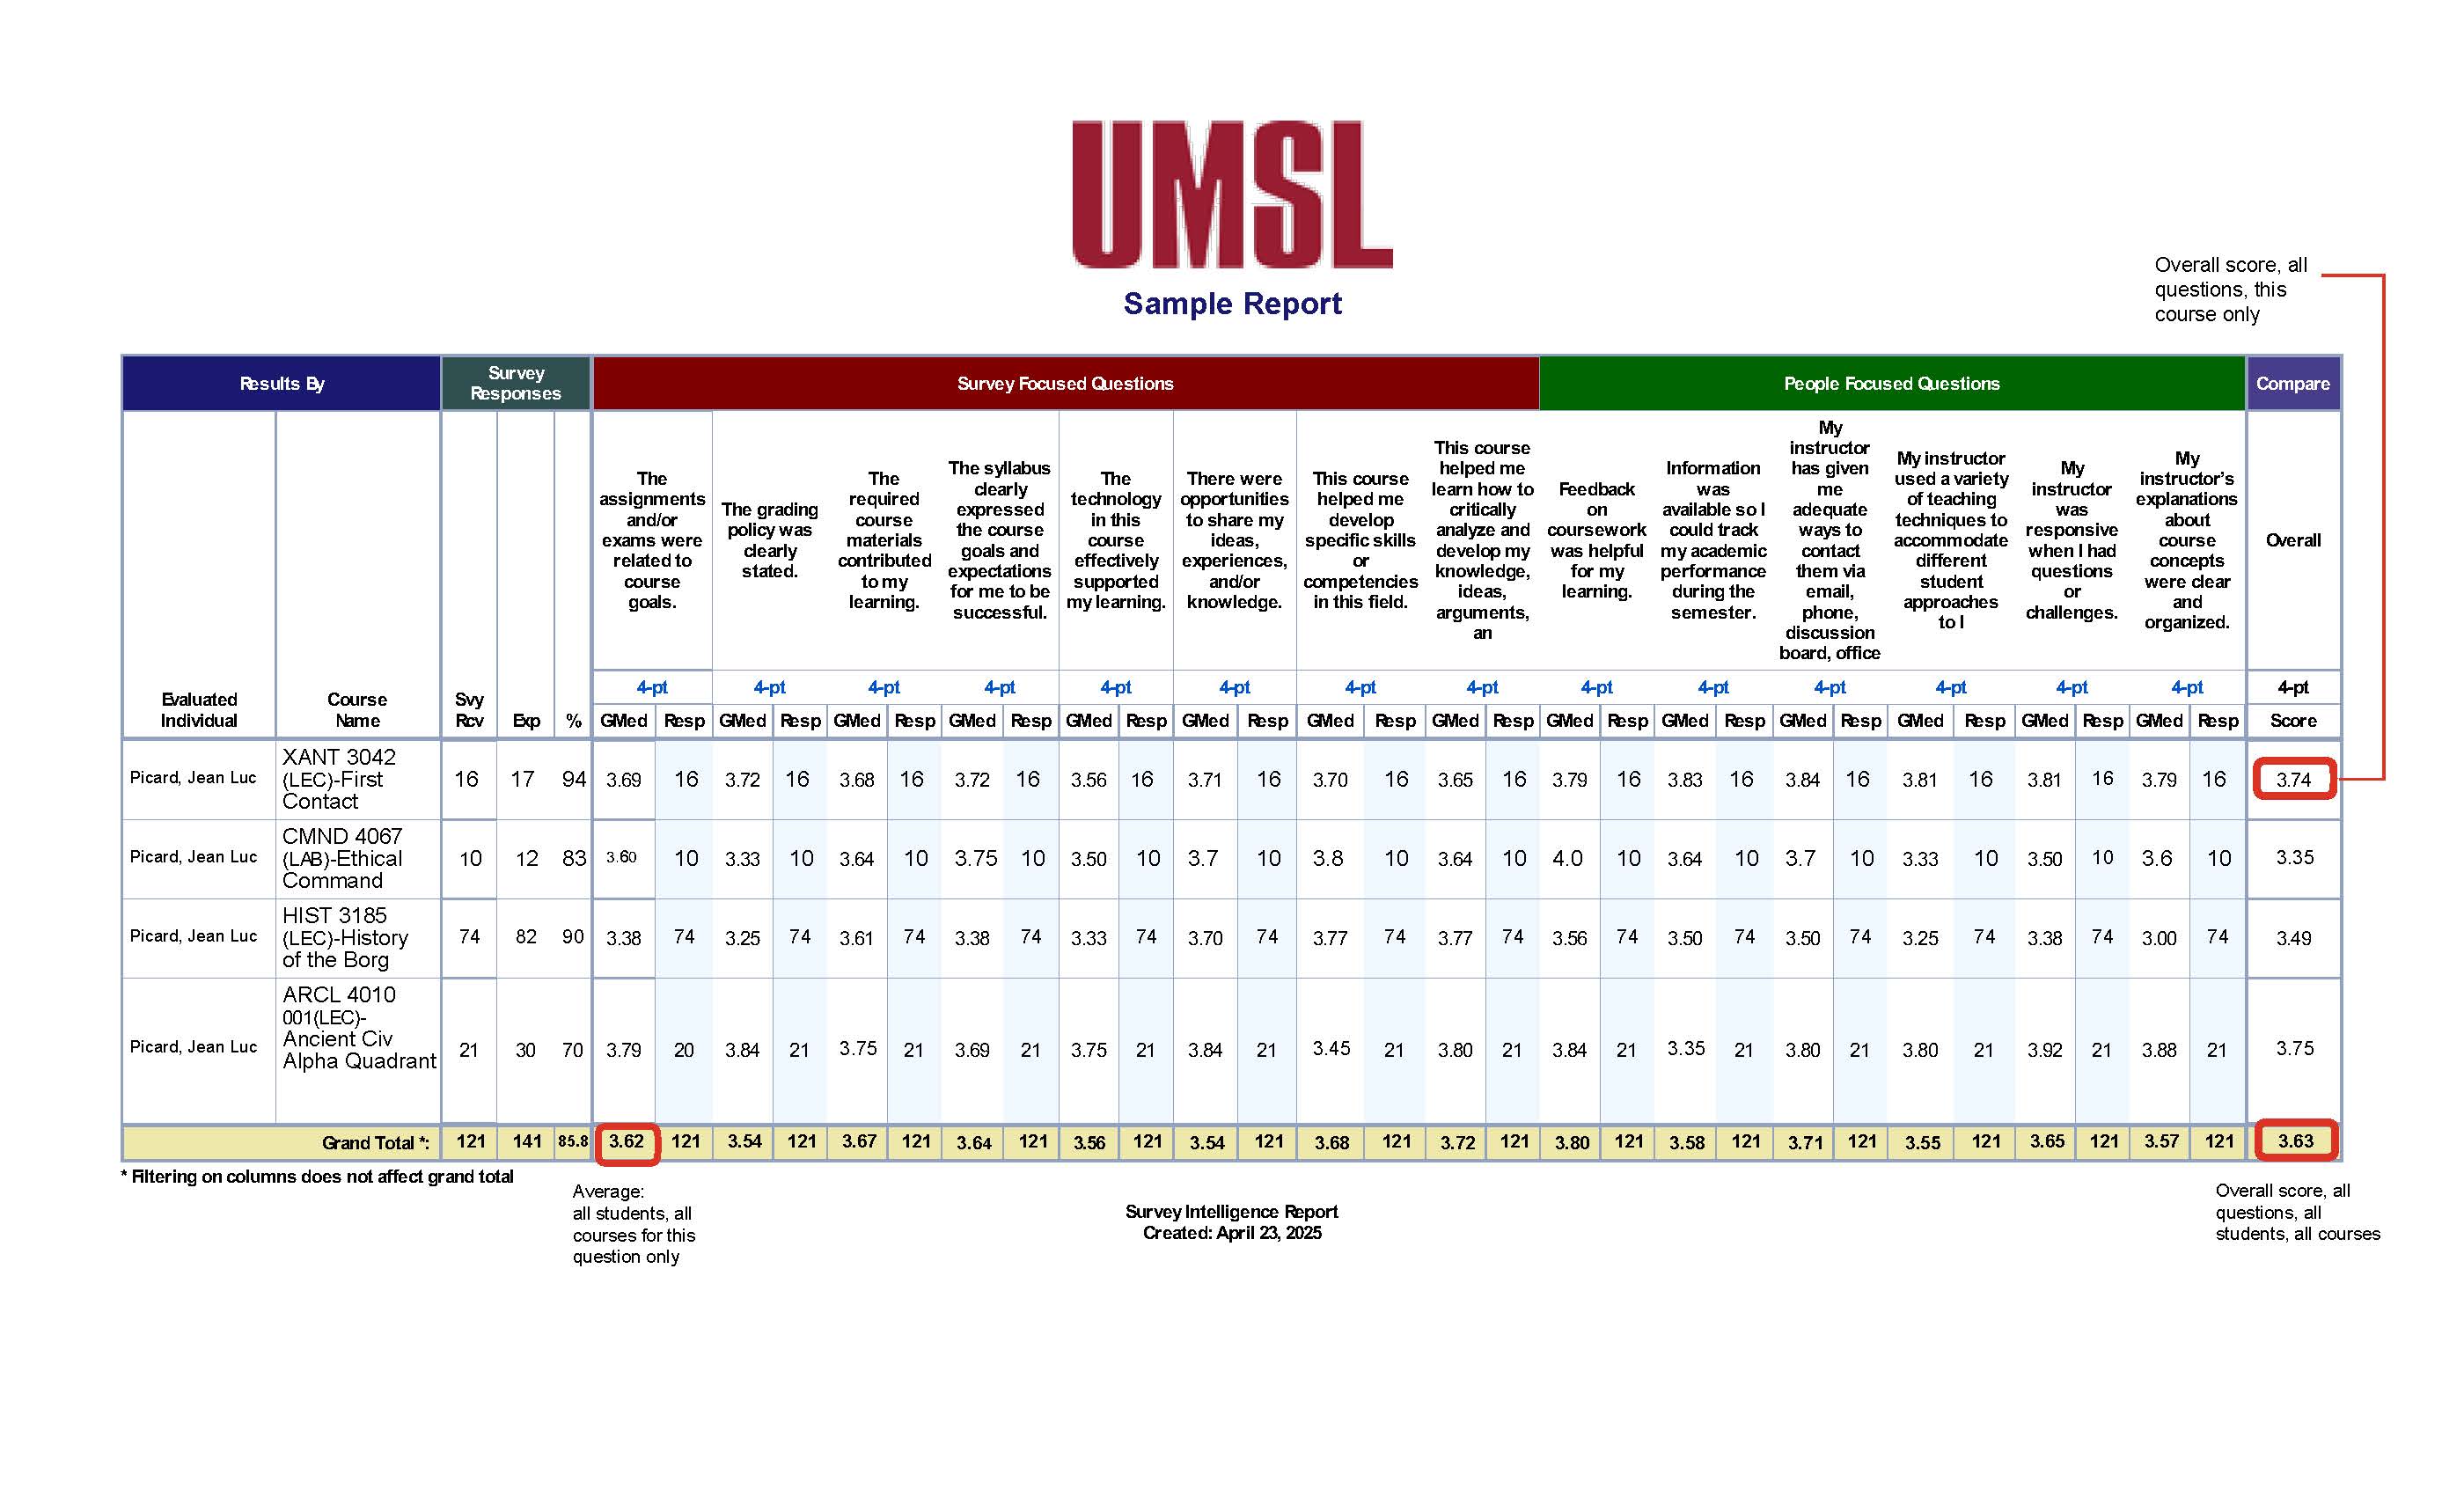
This Survey Intelligence Report on a fictional faculty member shows how they performed on each quantitative student feedback survey question across every course they taught for SP25. Their “overall” score for this survey is indicated in the bottom right.
The Survey Intelligence report is an efficient option for users looking to capture overall performance on specific questions or surveys. It can gather information for a specific semester or over a series of multiple semesters.
Looking for a step-by-step guide to make a Survey Intelligence report? View our guide.
Below, we have indicated where the overall score is located per question and the overall score on all quantitative questions for all courses taught in a given semester.
Faculty Survey Intelligence Report PDF
Determining Unit Totals for Comparison
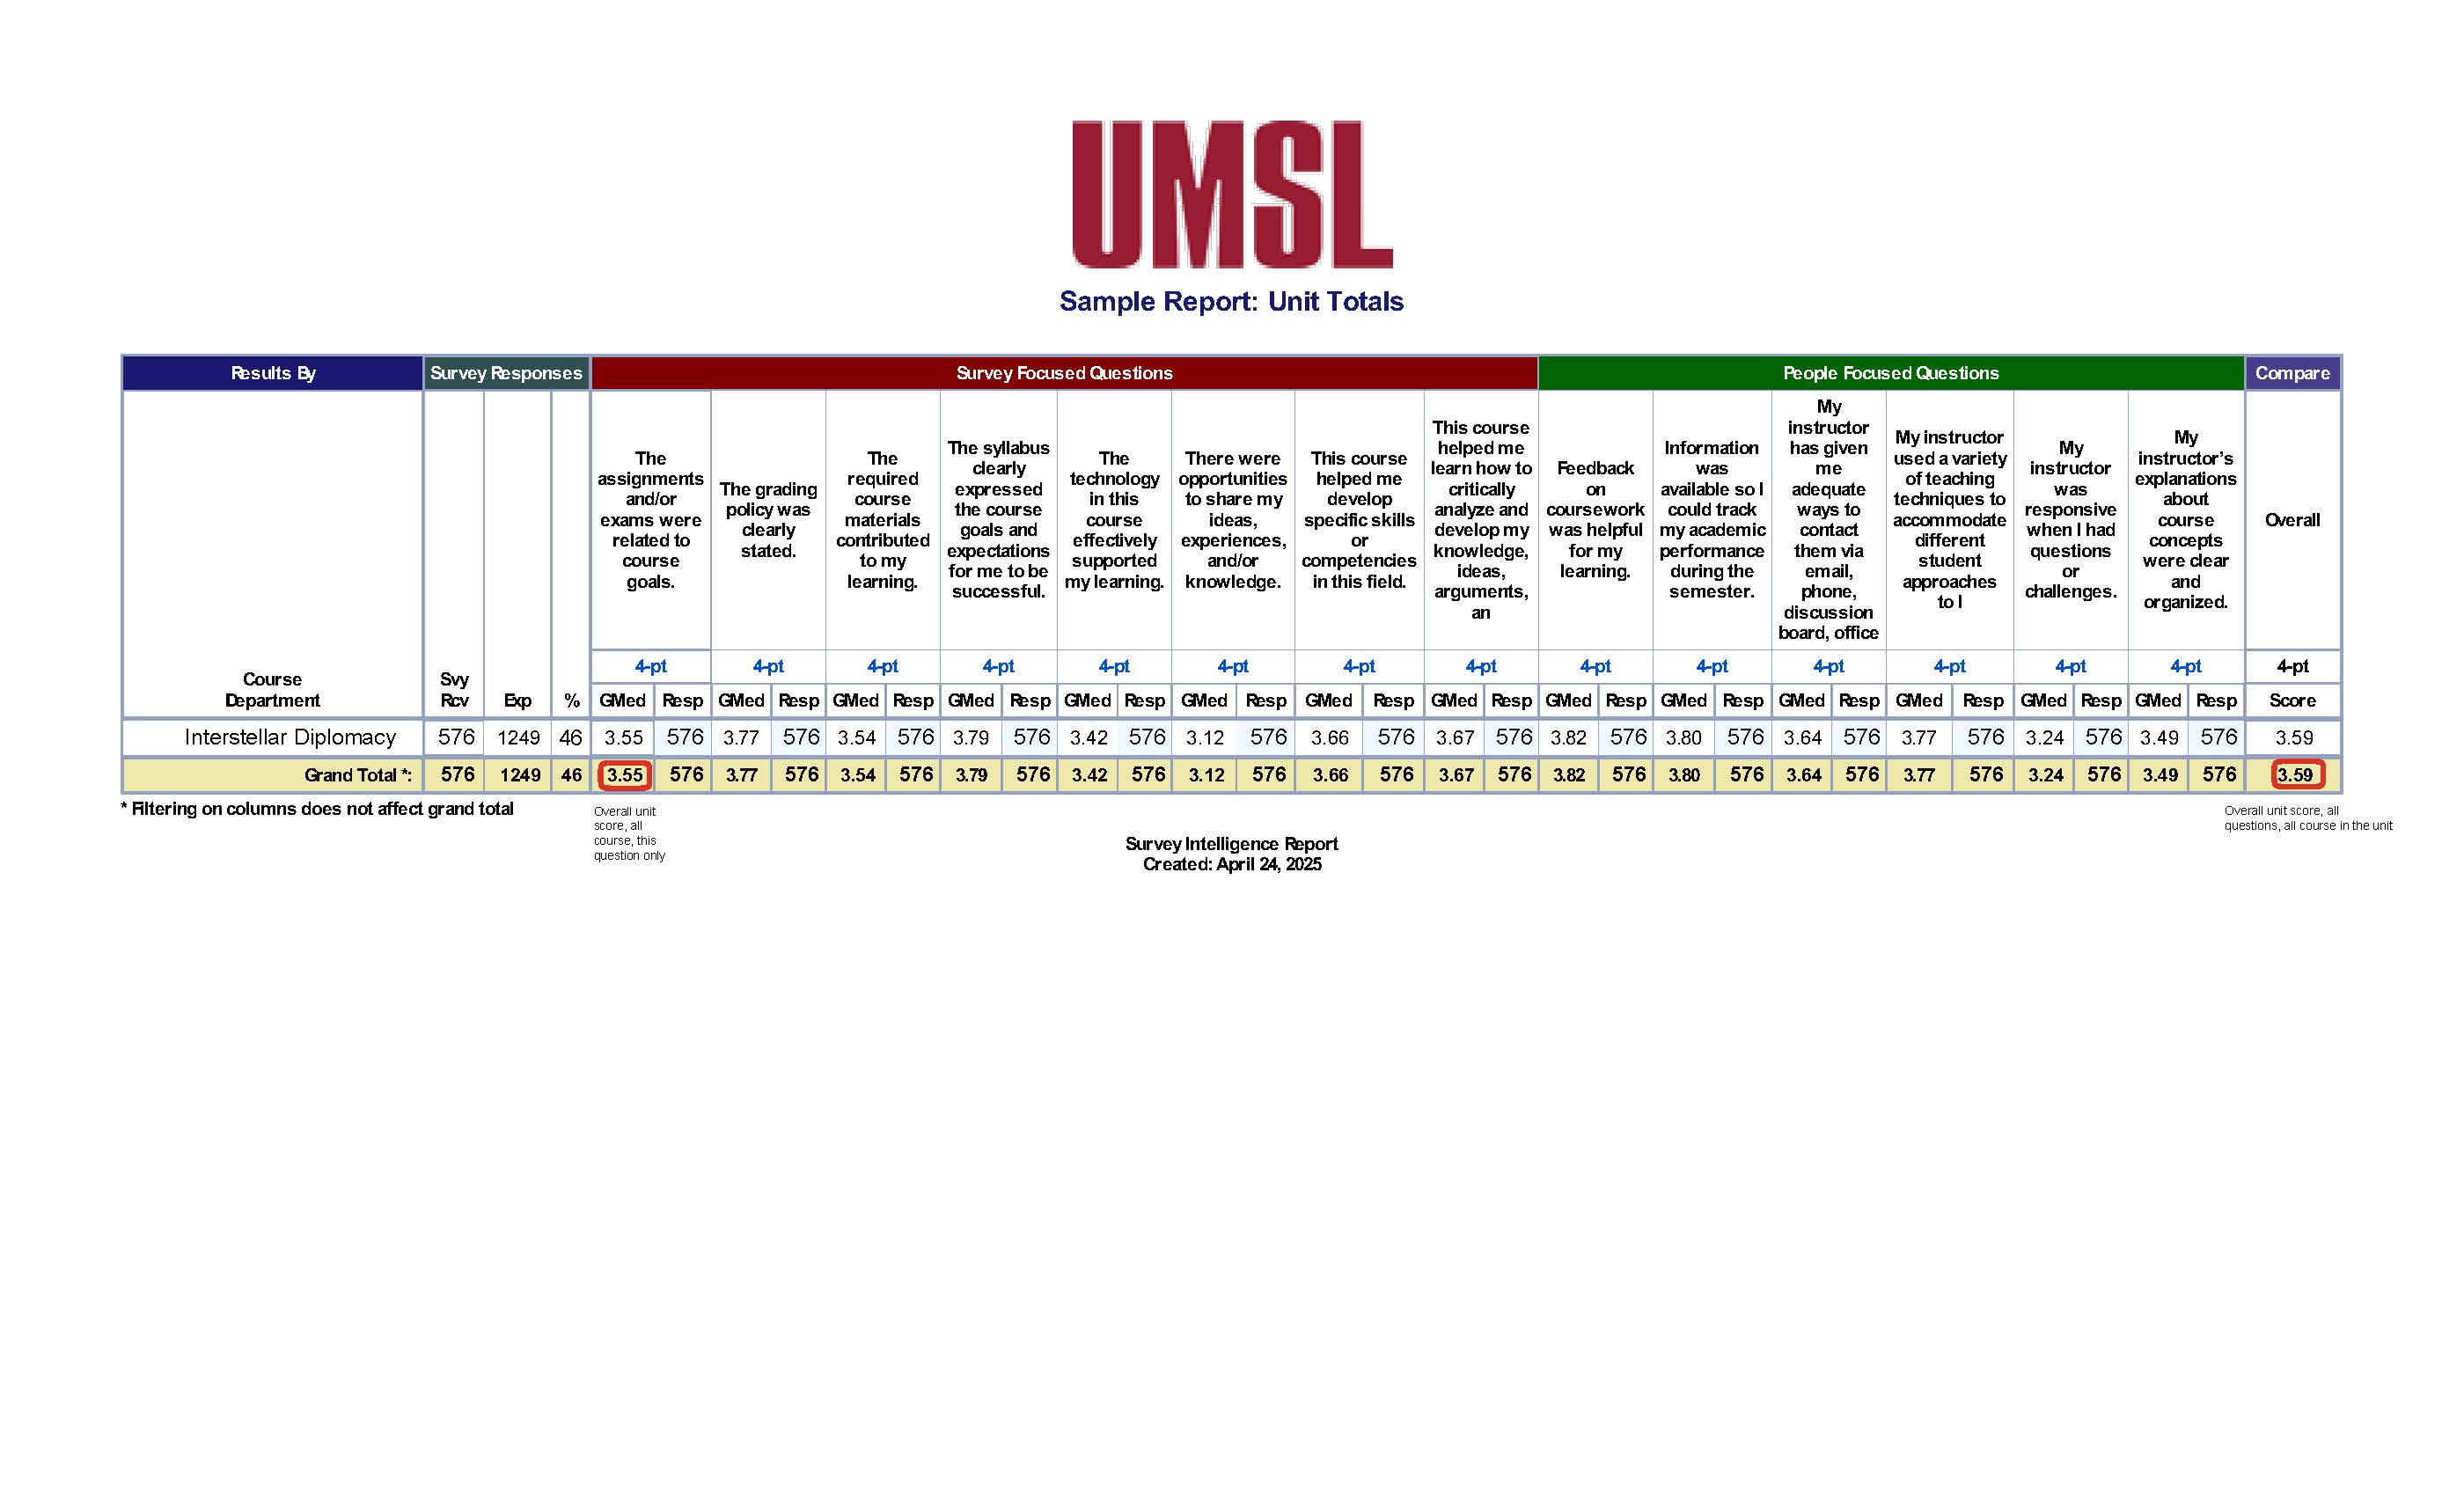
Survey Intelligence reports can also generate an overall unit score, as shown here for a fictional department. The overall score of this unit for all quantitative student feedback survey questions in located in the same position: the bottom right corner of the report.
What to Do with Qualitative Data
The “Overall” score a faculty member receives in the quantitative results of their student feedback surveys is a convenient and efficient way to compare a faculty member to the performance of their unit; however, the context of these courses and student voice in their own learning experiences provide valuable insight that an aggregated number cannot show. Theming these comments is a skill that helps identify patterns of experience that can help illuminate the learning experience of the student in the faculty member’s courses.
Considerations on Qualitative Comments
Differentiate Controllable vs. Uncontrollable Factors
Focus your evaluation on comments related to the instructor’s teaching practices, not external factors like room conditions or scheduling, which are outside their control.
Account for Systemic Bias
Be mindful that evaluations often reflect implicit bias, particularly against women and instructors of color, and may vary based on course size, level, or format.
Interpret Emotional Tone Thoughtfully
Recognize that negative comments may carry disproportionate emotional weight. Assess the feedback’s substance, not just its tone or length.
Identify Consistent Patterns
Look for recurring themes across comments rather than placing weight on isolated praise or criticism. Contradictory feedback is common and should be contextualized.
Assess Feedback with Nuance
Consider the distribution of responses, not just averages, and group comments by relevance (e.g., content, facilitation) to better understand teaching effectiveness.
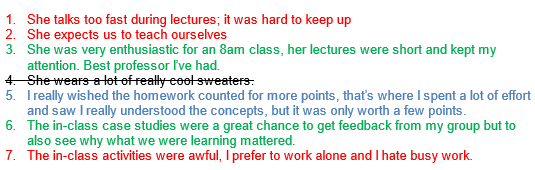
These comments are themed by tone, but theming by categories (materials vs. design) can yield additional insights into the learning experiences of students in a faculty member's courses.