Student feedback surveys (previously referred to as course evaluations) are often used as one component of annual reviews, tenure and promotion decisions, and teaching awards. A change in the scale and questions used in these surveys may be concerning if you are preparing materials for promotion or tenure or trying to demonstrate a pattern of excellent teaching. Here we outline a few ways to minimize the impact of UMSL’s adoption of the new common question set.
The move to the new common question set brings with it a change in the scale of responses that students are able to choose from. The scale on your department’s student feedback survey may not match the scale that will be used moving forward from Fall 2023. The new scale and CoursEval reports will provide data on the number of students that Strongly Agree, Agree, Disagree, or Strongly disagree to the statements on the survey. Students will also have the option to mark a statement as Not Applicable.
Questions that make use of scaled responses of student attitudes or opinions (also known as Likert scale responses) are sometimes averaged to find a single value to estimate overall student agreement or disagreement. However, this value is rarely useful given the constraints of the Likert scale itself. If Strongly Agree on a question set is assigned a value of 4 and Strongly Disagree is assigned a value of 1, an average Likert score of 3.4 is ambiguous, there is’t a response between Strongly Agree and Agree, so a value of 3.4 is confusing.
Let’s consider two hypothetical instructors and their feedback scores for the first question:
"The syllabus clearly expressed the course goals and expectations for me to be successful"
The responses for this question from 20 students are:
| Scale | Instructor A | Instructor B |
|---|---|---|
| Strongly Agree |
8 |
4 |
| Agree |
7 |
7 |
| Disagree |
1 |
9 |
| Strongly Disagree |
4 |
0 |
| Average |
2.85 |
2.7 |
This gives Instructor A an average score of 2.85, and Instructor B an average of 2.7. These averages are very similar, but if we take a closer look at the distribution of responses, we might be able to gather more useful information about how students viewed the syllabus in each of these courses.
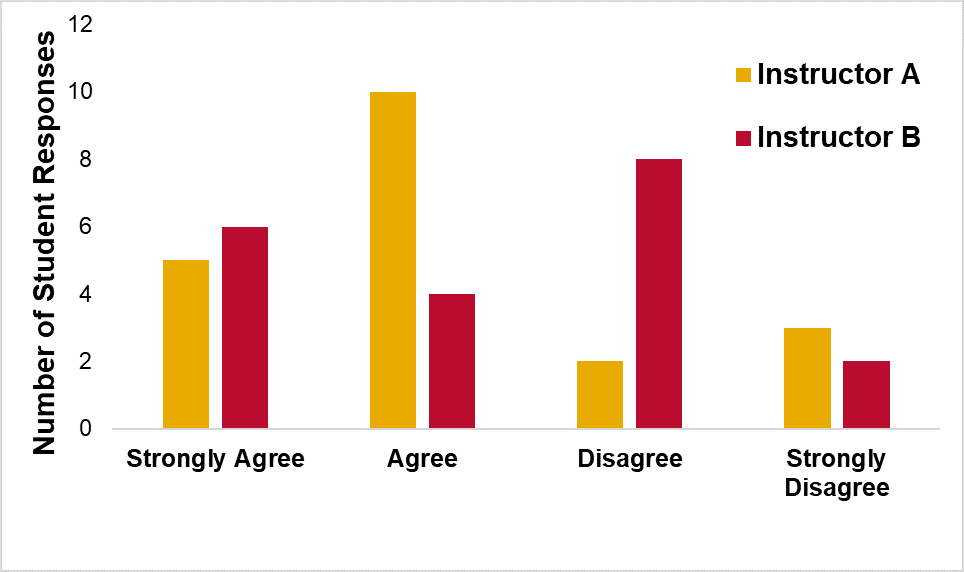
The distribution of student responses reveals that perhaps more students viewed the syllabus as clearly expressing the expectations of the course for instructor A while more students disagreed with that statement for instructor B. Presenting the distribution of responses from student feedback surveys avoids concerns associated with using an average of Likert responses. This is also a way to display data that may not be comparable if a different scale was used prior to the adoption of the common question set.
An additional challenge that could occur with the shift to the new common question set is related to the number of choices in the scale for students. We cannot compare the average scores on this syllabus survey question if prior to the common question set students were given a scale that included a neutral option (Strongly Agree, Agree, Neutral, Disagree, Strongly Disagree). The highest possible score with that scale would be 5, while the highest possible score on the new scale is 4.
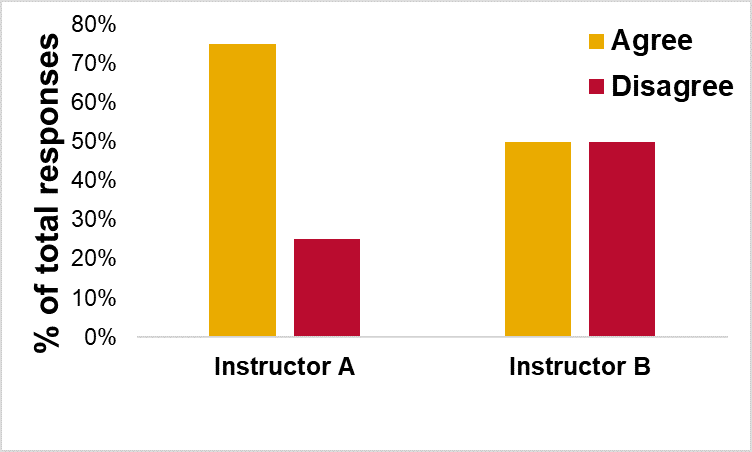
One way to address the change in scale issue as well as the challenge of comparing averages for likert data is to present the information as the percentage of students that expressed agreement with a survey question. For the new common question set scale (Strongly Agree, Agree, Disagree, Strongly Disagree, N/A) we can total the number of students that selected Strongly Agree and Agree and divide that by the total number of responses (excluding students that selected N/A). For our hypothetical example, this would mean 75% of students agreed with Statement 1 for Instructor A, while only 50% of students agreed with that statement for Instructor B.
If we were doing a similar analysis for the previous year’s student feedback data that had a 5 point scale, we would combine the number of students that Strongly Agreed or Agreed together and divide that number by the total number of responses on the survey minus those selecting the neutral response. This would then allow us to compare % agreement across years when the scales may have been different.
Historically, student feedback and course evaluations made up a significant component of how instructors were able to document their teaching effectiveness. UMSL’s Teaching Effectiveness Taskforce (TET) sought to challenge this idea and worked diligently to develop a definition of teaching effectiveness that could anchor not only the questions asked on student feedback surveys but also help to shape both peer feedback and self-reflection. UMSL’s Teaching Effectiveness definition is centered around three anchors, a student-focused learning environment, intentional instruction and assessment, and disciplinary expertise.
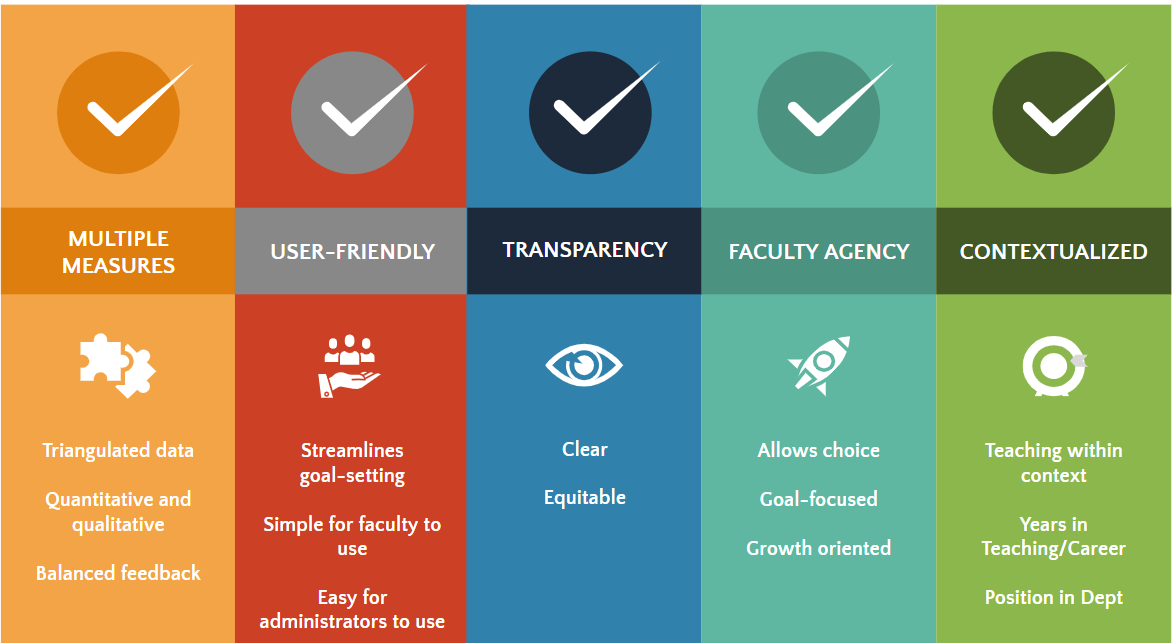
UMSL’s TET has proposed a holistic tool to make teaching evaluations more systematic and equitable, evidence-based, able to recognize and reward good teaching, and rooted in the anchors of the teaching effectiveness definition.
These are the five core qualities of UMSL’s holistic model for evaluating teaching.
A draft of the Holistic model for teaching effectiveness is currently being tested in focus groups and should be available soon for wider use on campus. If you would like more information or to pilot the holistic model of teaching effectiveness, please reach out to your department chair and or the TET.