We are a public research university guided by a powerful mission to transform lives.
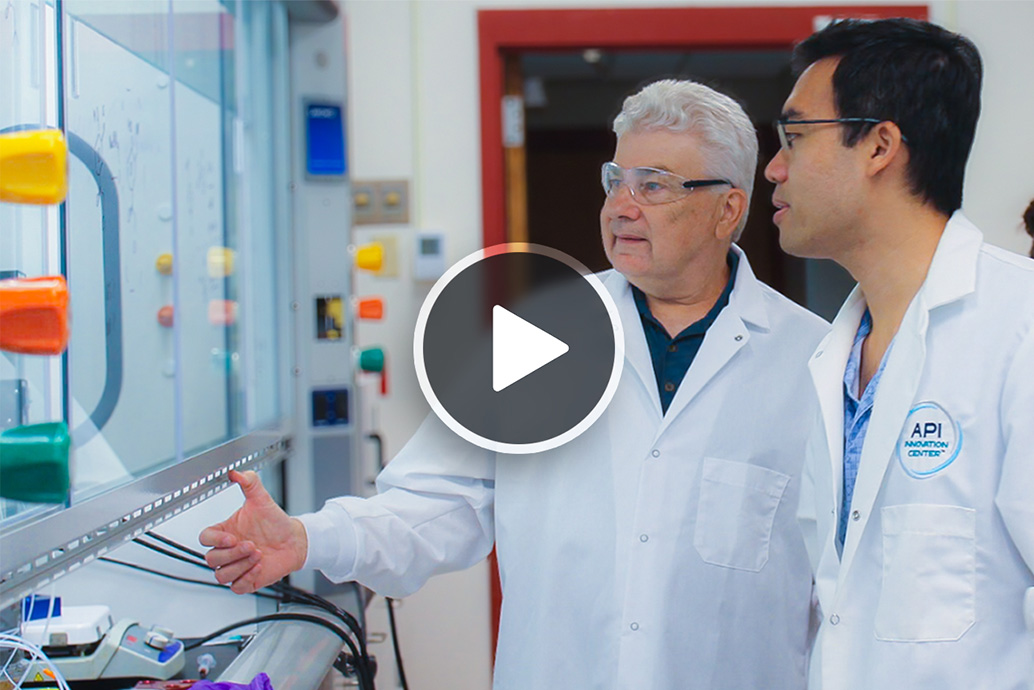
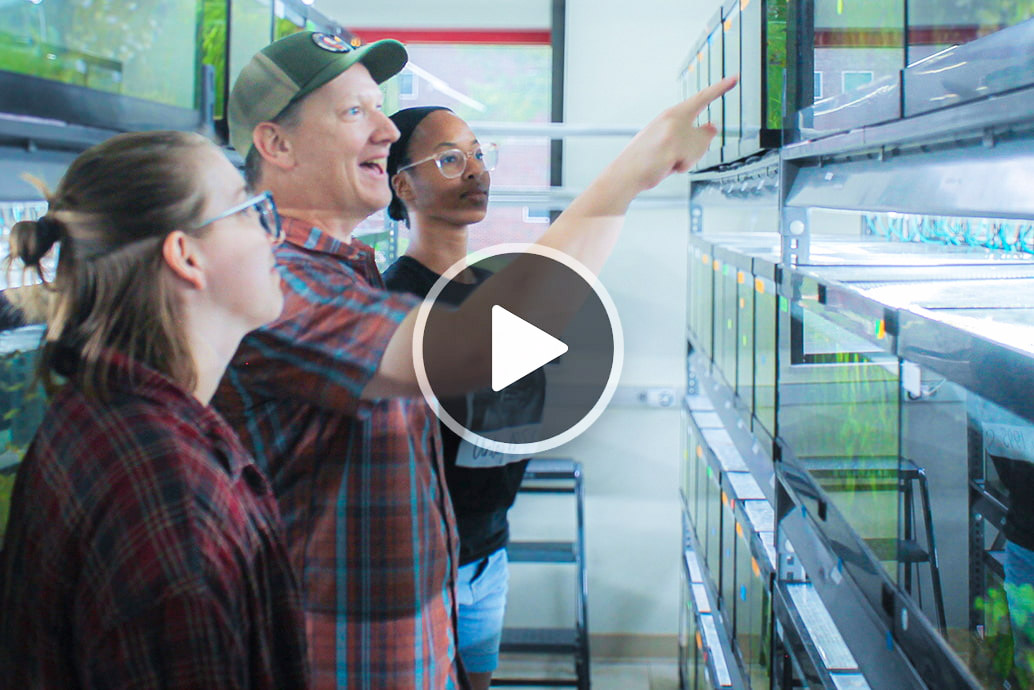
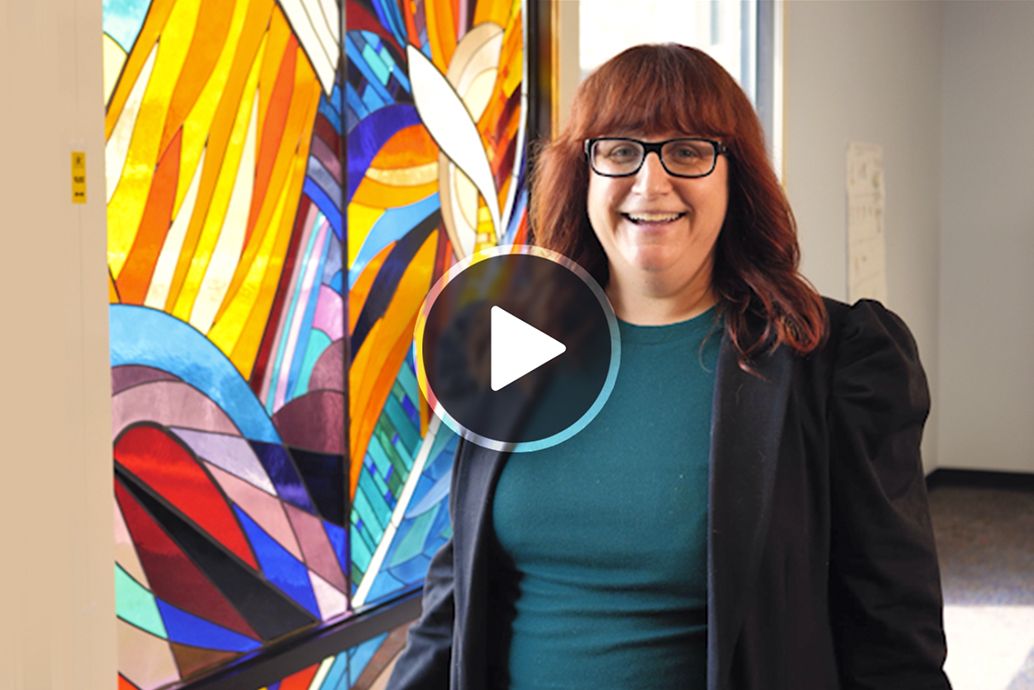
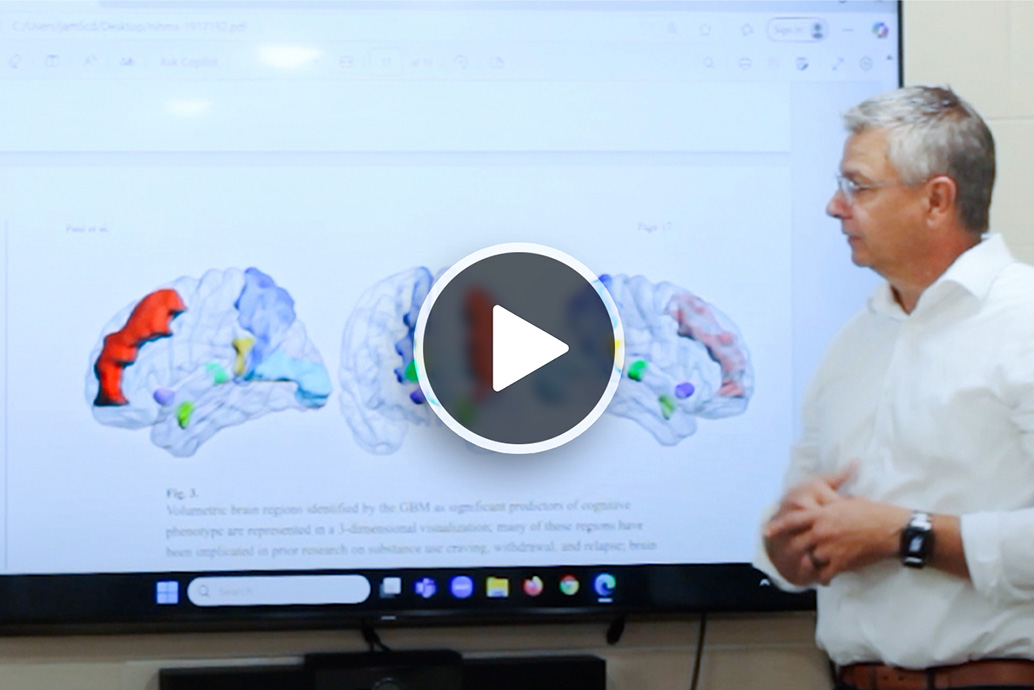
At UMSL, eastern Missouri’s only public research university, highly talented researchers work to solve some of society’s biggest problems. Fueled by powerful partnerships with industry, government and nonprofits, UMSL faculty work across disciplines and with the community to co-create new knowledge and solutions related to disease, drug shortages, health inequities, food safety, climate change, urban education, addiction and mental health, justice system reform, and so much more.
Collectively, our team works to empower UMSL’s research community with the resources, tools and support to conduct rigorous, impactful research and bring your discoveries and creative works to market as useful products, services and solutions that improve people’s lives.
Driving Innovation. Real World Impact.
Working for the St. Louis Region and Beyond
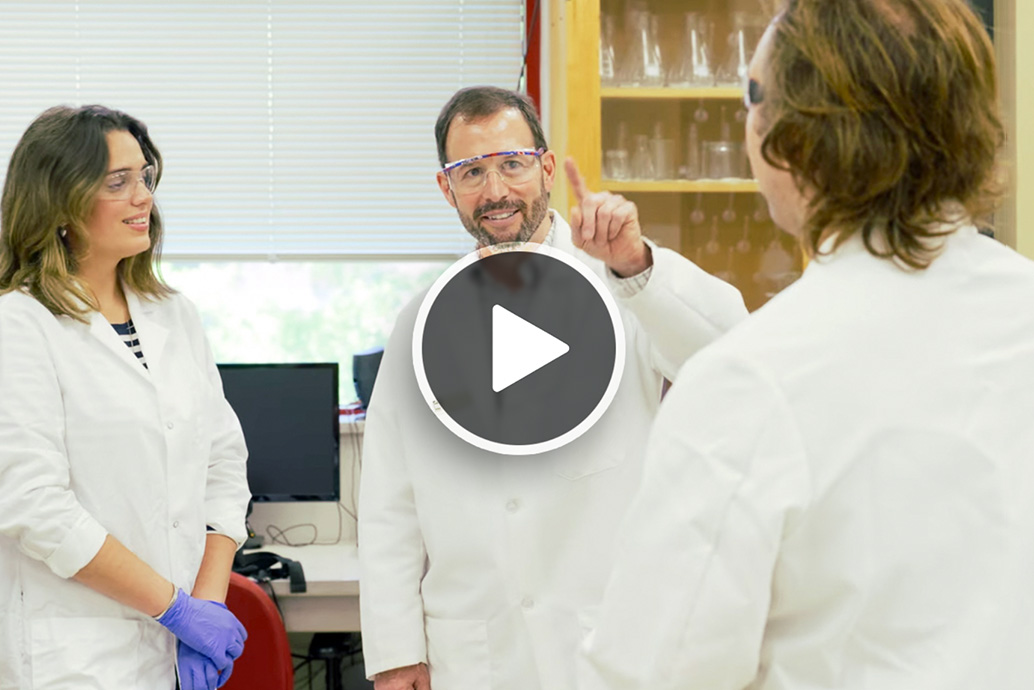
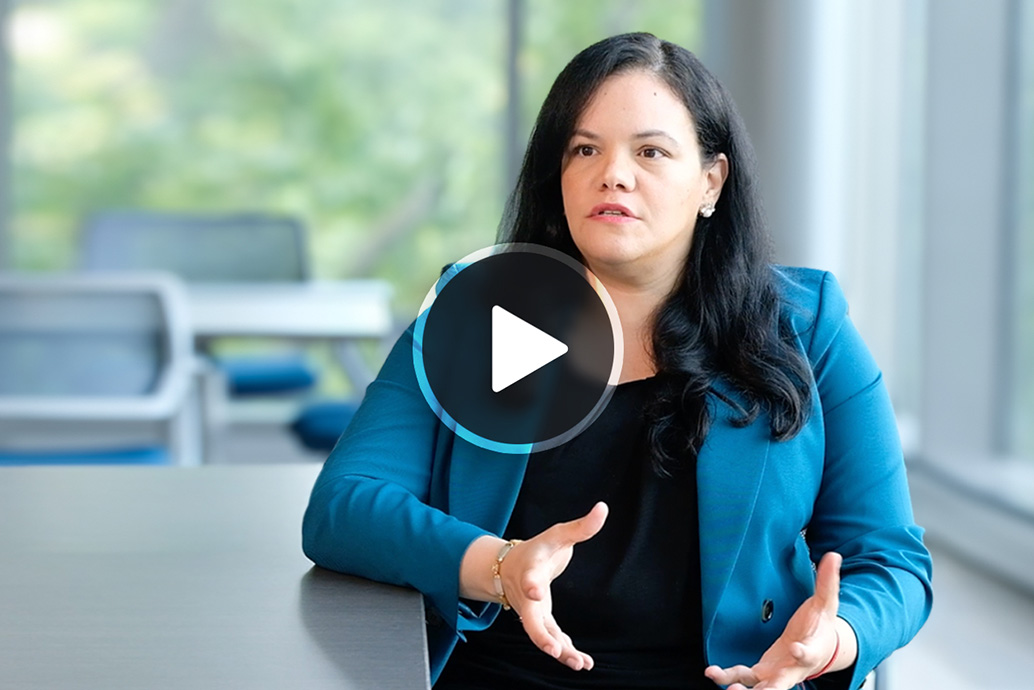
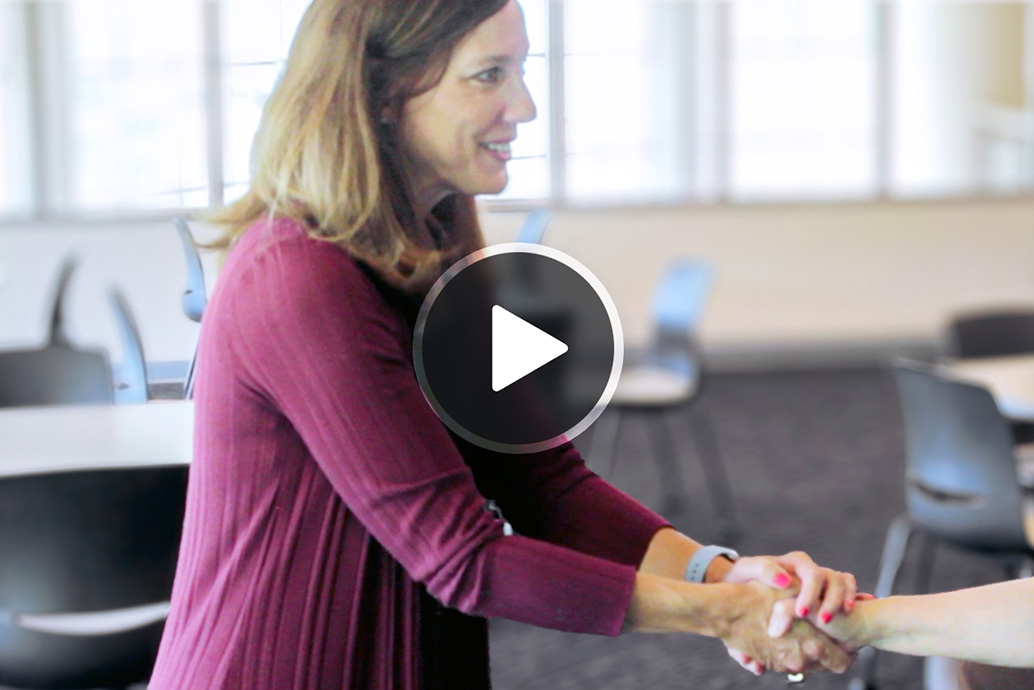
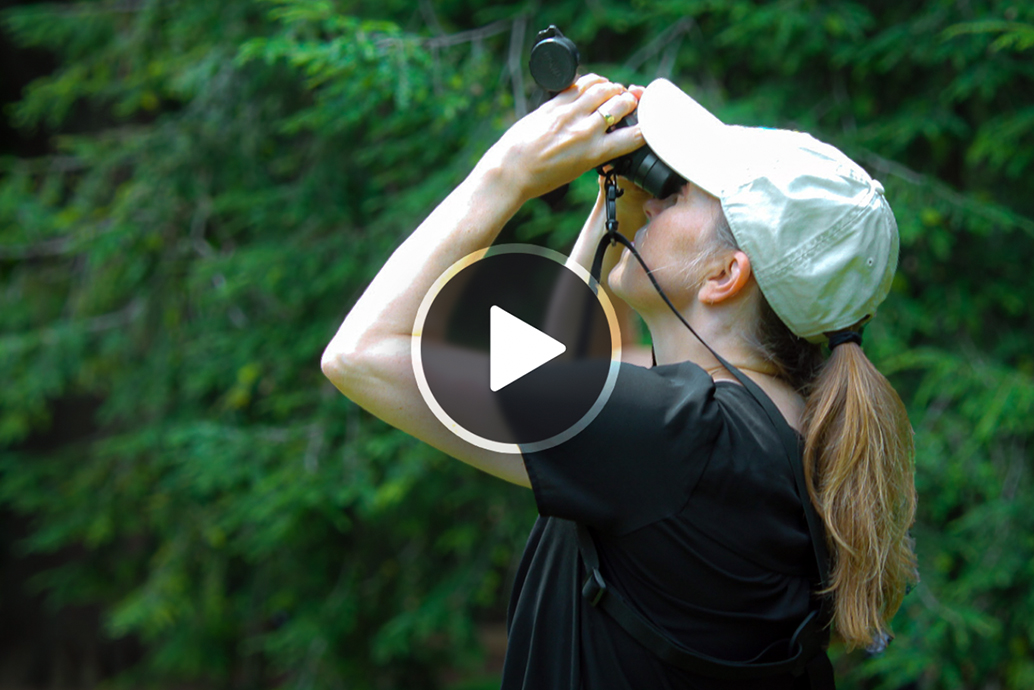
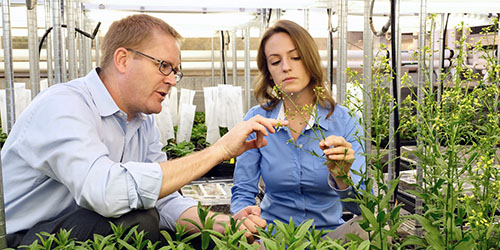
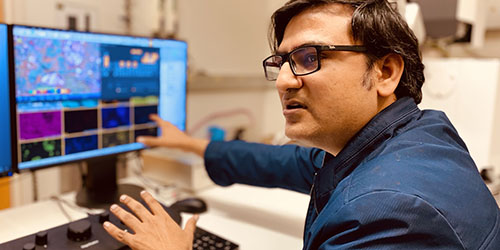
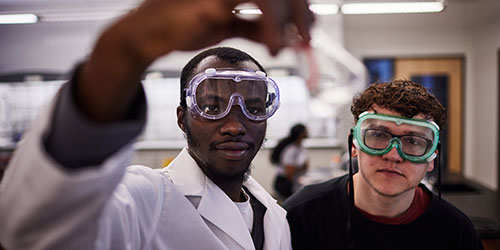
The Office of Research, Economic and Community Development at the University of Missouri-St. Louis is pleased to present the Research Impact Video Series. In this short video series, our research faculty across diverse fields in Chemistry, Neuroscience, Social Work, Supply Chain, Biology and Education share how they are working to solve real world problems affecting Missourians and the nation.