
Extreme physics data and simulations (e.g. of high speeds and small sizes), delivered modeling-workshop style with self-discovery rather than rote-learning the goal, can provide explorers of any age with clues to how science adapts to new phenomena. In particular, high speed airtrack simulations offer clues to relativistically informed patterns of thought (e.g. local rather than global time), and data for non-trivial experiments describing motion at any speed. For example, with a compressable spring plus a ``fast'' clock-equipped glider and timer gate-pair, Minkowski's spacetime version of Pythagoras' theorem (the flat-space metric equation) is there to be found. With a second glider, ``anyspeed'' expressions for momentum and kinetic energy emerge experimentally as well.
Sound Bytes: teaching Newton with
anticipation | fasTrack | map-based motion at any
speed
This figure shows how a spaceship capable of 1-gee acceleration for 100 years (and an amazing ability to avoid head-on collisions) might power a round trip to most anywhere in the visible universe and back in a traveler lifetime.
The dotted line shows how far the same round trip would take a traveler if Newtonian physics applied instead. As you can see, the lightspeed limit improves travel prospects for the accelerated traveler even though it makes things worse for the couch-potato who waits at home for the traveler to return.
The bronze thrust profile inset above for a 5 traveler-year one-way trip to Proxima Centauri shows how the thrust profile (proportional to cross-sectional area) would vary during the trip. The orange mesh line around the profile corresponds to the thruster turnaround point in the trip. Even longer trips would exponentially decrease traveler time for the trip, but only at the price of a comparably-exponential increase in fuel mass on launch.
Radar-separation ρ-cτ contours (red) in x-ct space (left panel) and free-float-frame x-ct contours (brown) in ρ-cτ space (right panel) for a single burst of constant proper-acceleration. Here x and t refer to distance and time measured with respect to a reference map-frame of co-moving yardsticks and synchronized clocks, while ρ and τ represent radar distance and radar time associated with events from the perspective of an accelerated observer.
The free-float-frame (reference map) origin in both figures is a dashed brown line, while the accelerated traveler trajectory is in red. Two large purple dots mark the start and end of traveler acceleration, while two large green dots mark float-frame-origin light pulses that might trigger and then detect the traveler's acceleration shutdown. Another six events are shown as smaller bright-green or indigo dots in both panels.
We show below that the "past" (magenta) 00-zone and the "future" (yellow) 22-zones are both flat-space coordinate systems, which look different only because of their differing x-velocity. The metric for tracking radar coordinates (ρ-cτ) in each of the other seven zones, however, is not flat but has been expanded in the acceleration direction and shrunk looking back.

The above plots were inspired by Dolby and Gull (Amer. J. Phys. 69:12, 2001, 1257-1261), although they include radar-distance contours as well as radar isochrons. They also cover a different set of traveler situations. For example the vertical extent of the thick line segments here illustrates the apparent dilation (or eifo-slowing) of a traveling clock's time, while the lateral separation between small horizontal dot-pairs illustrates the apparent contraction (or eifo-shortening) of a moving object's length.
The figure at left illustrates radar-separation hypersurfaces for an accelerated traveler's roundtrip. Using the axis-labeled units, it is basically a one-gee ~ 1[ly/y2] acceleration round-trip which takes 4 traveler years to complete.
Four purple dots mark engine on/off events as well as the two mid-voyage points at which the direction of acceleration is reversed. Null trajectories extending forward and back from these points define twenty-five separate event-regions in space-time.
These zones (marked off by faint dotted lines) have blue radar-isochrons, and radar-distance grid-lines, drawn in to characterize for events from the accelerated traveler perspective. Separations in this case are at intervals of 0.2 (years or lightyears) from the traveler's radar-perspective.
The two vertical dashed lines (brown) represent the world lines of home and destination sites that are stationary in the x-ct coordinate system here. Following the separation between start and return isochrons into the flat-space region to the right will allow you to measure the triptime elapsed on the traveler's clocks using the ct-axis calibration here.

This plot illustrates how coordinate acceleration a's magnitude falls off at high speeds given a constant rightward proper acceleration α, as well as how the frame-variant force f ≡ dp/dt deviates from mass times proper acceleration (in both direction and magnitude) only to the extent that an object's motion perpendicular to the proper acceleration direction is significant.
For fixed rightward proper force mα, the contours show the magnitude of mass times coordinate-acceleration i.e. ma (also directed to the right), while the arrows show the direction and magnitude of momentum's rate of change f ≡ dp/dt. The color or hue of the arrows corresponds to their length. Hence red corresponds to f ≈ mα.
Things to note in the fixed proper-acceleration α figure at right:
Here Lorentz factors γ ≡ 1/Sqrt[1-(v/c)2] and γ⊥ ≡ 1/Sqrt[1-(v⊥/c)2].
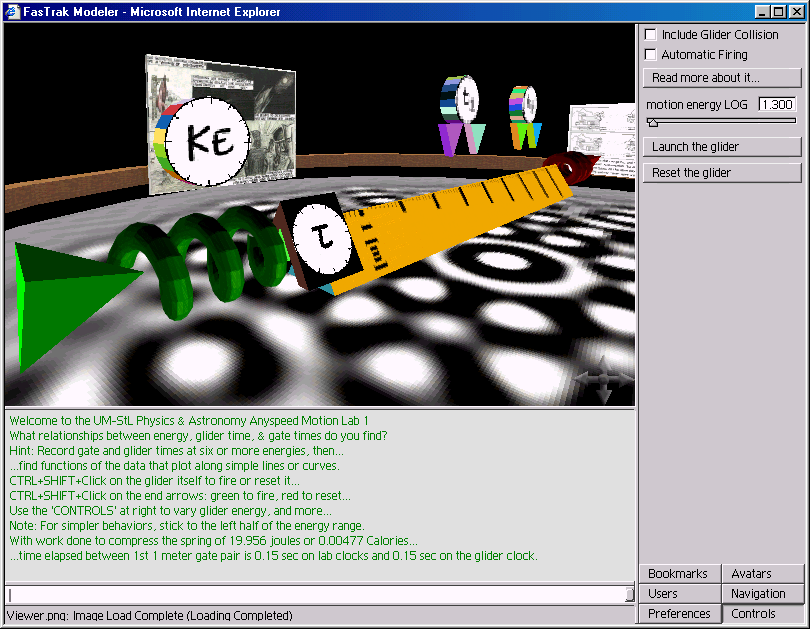
Below are some screenshots of our earlier Adobe-atmosphere web-LAB's "fasTrack" unidirectional anyspeed modeler.
Places to read more about the kinds of data it, and our currently-available applet simulators, were designed generate include:
* which
might be only for teachers. Send me a note at
pfraundorf@umsl.edu , if you are interested in these.
This exercise might help you answer some of the extreme physics questions about lower lightspeed given on our wuzzler's page:
More ambitous explorers might even stumble upon Minkowski's space-time version of Pythagoras' theorem, or perhaps the same rose by a different name...
* i.e. outlining specific data sets, followed by graphing, followed by
mathematical analysis, that would lead students to a set of common
take-home conclusions.
Access to our live simulator in Adobe Atmosphere is available in [PDF form] through Adobe's most recent (v6.0.1+) browser. Those running w98 or later and Internet Explorer can visit it directly [here], or using Adobe's now defunct standalone player: [here]*. Hint: If you first turn on collision and reduce the speed of light to 55[mph], no data analysis is needed to see that something is strange when glider energy is increased. Even more enlightening: Compare equal-energy launches with different values for the speed of light. This is tough to do with the air tracks found in most high school labs!
* Note: If Adobe's new Plug-in does not load after a few minutes, and there is only a blank screen, they suggest downloading the viewpoint/atmosphere minimal installer, running it, and then trying again. Also a version of the lab for pre 8/12/2002 browsers may be found here.
BiBTeX reference:
@article{fasTrack,
author = "P. Fraundorf et al.",
title = "An experience model for anyspeed motion",
eprint = "arXiv:physics/0109030"}
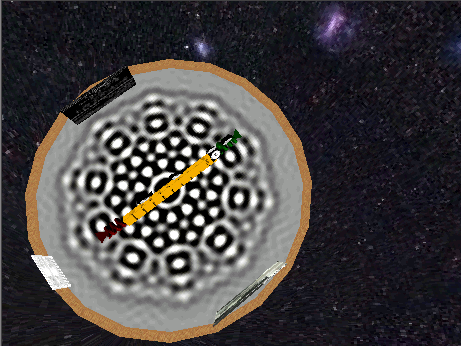
Here's a top-down view of the experiment station, with small and large Magellanic clouds in the background...
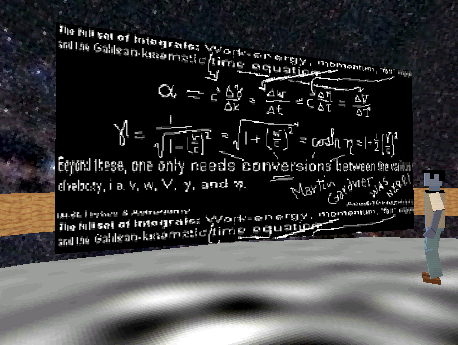
Here's a discussion of unidirectional proper acceleration at the blackboard...
Here's closeup of the rigid nano-composite spring which makes such high energy glider launches possible...

It looks like a crowd is starting to gather here, just as the station is about to eclipse our view of Andromeda...

This is a now rather ancient image of fasTrack...
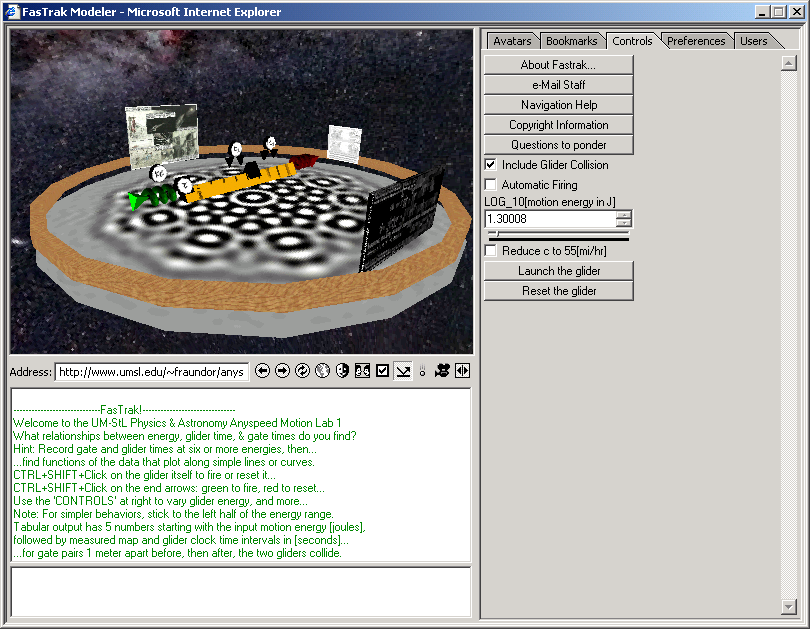
...and here's what the new browser version of fasTrack looks like...
 |
This PIRA
Webring site is owned by < prev | List Sites | next> |