|
Data Flow Diagrams Examples
We will study a variety of diagramming tools this semester. As with other topics we have studied, one must use the kind
of tool that helps one accomplish a particular task at a particular time.
 View pdf version
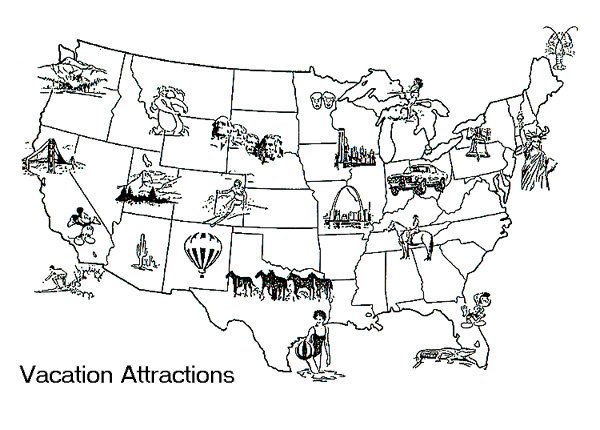
Consider the two maps of the United States below. They both show the states, but give very different
information about them and would serve different purposes for decision making.
 View pdf version
 View pdf version
Data Flow Diagrams (DFDs), as the name suggests, illustrates the flow of information in a system. They are
hardware independent and they do not reflect decision points. Rather they demonstrate the information
and how it flows between specific processes in a system. They provide one kind of documentation for our reports.
Deliverables for Process Modeling
- Context Diagram
- DFD's of current physical system
- DFD's of the current logical system
- DFD's of the proposed logical system
- Thorough descriptions of each DFD element
Naming Conventions:
- Data Flows: name of the packet of information (arcs)
- Data Stores: name of the data stored there (rectangle)
- Transformations: name of the activity (bubbles)
- Origins and Destinations: name of producers, customers, etc. in the environment (boxes)
Since they generally describe a complex system, there are layers of DFD's that show increasingly more
information about the processes. Consider the diagram below.
 View larger version View the table version
These diagrams show a group of related sets:
- Context Diagram: This is the highest level and represents the overall system and its
interaction with its environment
- Level 0 Diagram: This shows the major subsystems and their interactions
- Level x Diagram: Shows the processes that make up each of the major subsystems
- Level x.y Diagram: Shows detail of the above diagrams
Each bubble on one level gets "exploded" to show the detail at another level. These pairs are referred to
as parent-child pairs. It is important to keep balance between the individual parents and their
children.
Numbering: Each process in Level 0 gets a number. Each child inherits the number. Bubbles on the child dfd maintain that number, and begin their
numbering as a number after the decimal point. These are unique numbers.
Advanced Rules Governing Data Flow Diagramming:
- A composite data flow on one level can be split into component data flows at the next level, but
no new data can be added and all data in the composite must be accounted for in one or more
sub-flows.
- The inputs to a process must be sufficient to produce the outputs (including data placed in
data stores) from the process. Thus, all outputs can be produced, and all data in inputs move
somewhere, either to another process or to a data store outside the process or on a more
detailed DFD showing a decomposition of that process.
- At the lowest level of DFDs, new data flows may be added to represent data that are
transmitted under exceptional conditions; these data flows typically represent error messages
(e.g., “Customer not known; do you want to create a new customer”) or confirmation notices
(e.g., “Do you want to delete this record”).
- To avoid having data flow lines cross each other, you may repeat data stores or sources/sinks
on a DFD. Use an additional symbol, like a double line on the middle vertical line of a data store
symbol, or a diagonal line in a corner of a sink/source square, to indicate a repeated symbol. (Adapted from Celko, 1987)
When to stop:
- Each process is a single decision or calculation or a single database operation, such as retrieve, update, create, delete or read.
- Each data store represents data about a single entity such as a customer, employee, product or order.
- The system user does not care to see any more detail or when you and other analysts have dcoumented sufficient
detail to do subsequesnt systems development tasks.
- Every data flow does not need to be split further to show that different data are handled in different ways.
- You believe that you have shown each business form or transaction, computer screen and report as a single data flow.
- You believe there is a separate process for each choice on all lowest-level menu options for the system.
Class Examples of the Registration Process:
-
 Data Flow Diagram (DFD) Example (Context and Level 0 Diagrams). Data Flow Diagram (DFD) Example (Context and Level 0 Diagrams).
- Data Flow Diagram (DFD) Example (Level 4 Explosion).
An example of a data flow diagram for a library is also available on the Internet.
|