Alcohol
(See: Drugs in American Society, 5th, 6th, 7th, 8th, and 9th editions, Erich Goode, McGraw-Hill, 1999/2005/2008/2012/2014. Chapters 4/8, and Drugs, Society, and Human Behavior (7th ed), Ray and Ksir, Mosby, 1993. Chapters 9 and 10 and the disclaimer). Statistics are gathered from the various surveys discussed, especially: Substance Abuse and Mental Health Services Administration, Results from the 2013 National Survey on Drug Use and Health: Summary of National Findings, NSDUH Series H-48, HHS Publication No. (SMA) 14-4863. Rockville, MD: Substance Abuse and Mental Health Services Administration, 2014.
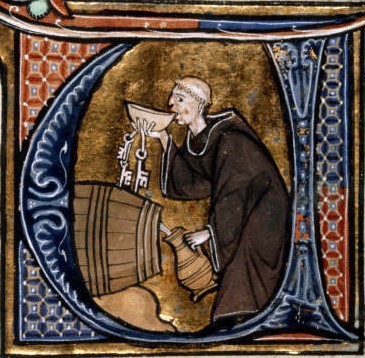
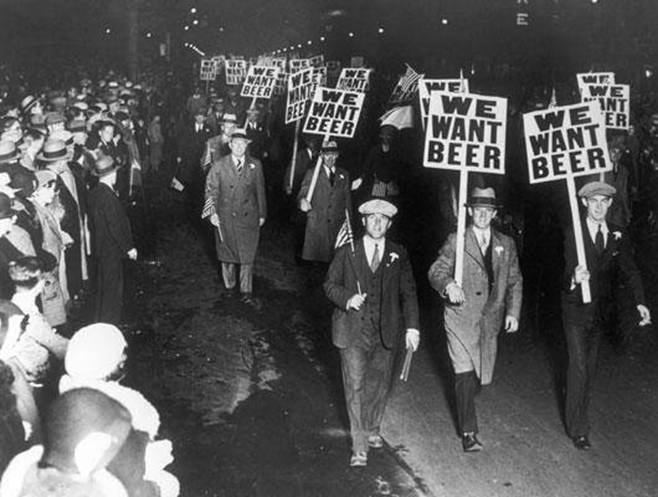
(This image is in the public domain because its copyright has expired: PD-old)

- Psychoactive
- Taken for Effect
- Recreational use
- Physical Dependence; Addicting in the Classic Sense
- Aside from nicotine and caffeine, most commonly used psychoactive substance
- Aside from cigarettes, most common form of drug addiction:
The alcoholic is the typical addict:
- Behavioral dependence is a reality for a sizeable minority who drink heavily despite the costs
- ALL Drinkers of alcohol ARE DRUG USERS!
- The American public does not equate alcohol use with drug use
- Production, Sale, and Purchase not a crime in most places and for most people
- Production and Distribution has been illicit (1920-1933)
History, Chemistry and Variety
Alcohol was discovered in 8327 B.C. on a warm afternoon by "Grog" who returned to his cave and drank the fermented milk of a coconut that had been cracked and left out in the sun. ;-) (it's a joke)
How much did they drink in medieval Europe?
- A natural process: Most fruits and airborne yeast (watch animals getting drunk in Africa)
- Fruit--sugar + yeast and Water==> recombines carbon, hydrogen and oxygen to produce ethyl alcohol and carbon dioxide.
- C6H12O6 (Glucose) + H2O==(Yeast)==> 2C2H5OH (ethyl alcohol) + 2CO2
- At about 15-20% ETOH the alcohol level kills the yeast and fermentation stops
- Alcohol's basic effects: Euphoria, Sedation, Narcosis, Pain relief. It is almost universally accepted in some form or other for some purpose or other.
- Cereal Grains can also be used: starch versus sugar- The Malting Process:
- Malting (sprouting) produces enzyme
- Slow drying kills sprout, preserves enzyme
- Crush, mix with water, enzyme converts starch to sugar
- Corn added to increase starch levels
(see: http://www.homedistiller.org/)
To produce higher levels of ETOH; heat mixture to evaporate alcohol, trap vapors in condensing coil-- Voila!: Hard Liquor (early distillation technology probably resulted in concentrations of about 50% (100 proof)
- Arabia ~800 A.D. (Alcohol is a derivative of the Arabian word for "finely divided spirit"-- the part of the wine derived from distillation.
- Only fermented beverages were known in Europe until the 10th Century when Italians began to distilled wine.
- Pure Ethyl Alcohol has been studied and used medicinally ever since.
- 13th Century professor of Medicine at Montpelier called it "Aqua Vitae" (Water of Life)
- In the 17th Century the Dutch came up with the name Brandy (Brandtwein): Burnt wine
- Whiskey (Irish-Gaelic equivalent for Aqua Vitae- visgebaugh):
- The Encyclopaedia Brittannica lists in its article on 'Alcoholic Beverages' the following dates and places of origin of several distilled alcoholic beverages. (credit to: http://www.bigfoot.com/~m_shapiro/cspirits.html--no longer active)
| DATE | MATERIAL | FERMENT | DISTILLATE | ORIGIN |
| 800 BC | rice
millet | Tehoo | Sautchoo | China |
rice
molasses
palm sap | Toddy | Arrack | Ceylon
India |
| mare's milk | Kumiss | Arika | Tatars |
| mare's milk | Kefir | Skhou | Caucasus |
| rice | Sake | Sochou | Japan |
| 500 AD | Honey | Mead | Distilled Mead | Brittain |
| 1000 AD | Grape | Wine | Brandy | Italy |
| 1100 AD | Oats
Barley | Beer | Usqubaugh | Ireland |
| 1200 AD | Grape | Wine | Aqua Vini | Spain |
| 1300 AD | Grape | Wine | Cognac | France |
| 1500 AD | Barley | Beer | Whisky
Aqua Vitae | Scotland |
- By 17th Century: 95% Alcohol possible
- Variety of grains used==> Grain Neutral Spirits ("Everclear")
- Variety of uses now: add to gasoline, industrial solvent, and (of course)-- beverages
- Proof at which distillation occurs==> Taste
- Proof==> twice the percentage of Alcohol: British army-- add to gunpowder and ignite==> "pooooff!" (57% alcohol)
- Higher the proof, lower the by-products: Congeners, other alcohols (methyl, isopropyl), oils.
- Whiskey became Common by 1500
- Scotch whisky (no "e"): Scotch: (1) malted barley, malt is dried in kilns fired by peat, and the liquor is stored for at least 3 years in barrels originally used to transport sherry
- Whiskey was Introduced to the Americas ~late 1700's
- Became the chief export of settlements west of the Appalachian Mountains: Grain to expensive to transport. 10 bushels of corn could be reduced to 1 barrel of whiskey.
- 1789: Elijah Craig of Bourbon, KY: Store whiskey in new, charred oak barrels: American bourbon. (Canadian whiskey: uncharred).
- Whiskey: Typically distilled at less than 160 proof (grain flavors)
- 51% of grain- rye==> straight rye whiskey
- 51% of grain- corn==> bourbon
- 80% corn===> Corn whiskey
- Dilute to 120 proof: age 2 or more years=> acquire more flavors. Typically further dilution
- Up until Prohibition: almost all whiskey in U.S.- bourbon, during Prohibition- Smuggled Canadian and Scotch: Lighter and Blended (2/3 straight whiskey, 1/3 GNS)
Consumption
Types
- Lager: (to store)Yeast settles on bottom (4%)
- Ale: Top rising yeast, fermentation temperature warmer, higher concentrations of malt and hops-- more flavor.
- Malt Liquor: Aged longer, more flavor (6-8%)
- Light beer: 10% less alcohol, 30% fewer calories. Fermentation is done at lower temperatures==> More alcohol and less sugar. Add water.
- Dry and Ice beers: same, without diluting (1990's)
- Non-alcohol Beer (since prohibition, recent popularity)
- World's Strongest beer. (update 2013)
Breweries and the Consumption of Beer
- Pre 1920: Thousands of Breweries (over 60 here in St. Louis)
- 1933- about 750 left
- 1941- 507
- 1976- less than 50
- Mid 80's ~40
- Now: Increase- microbreweries
- 6 breweries dominate 90% of the market: Busch: Over 48% (2007); Budweiser alone: 14% (2003)
- Light Beers: 30% of sales
- Foreign: around 5% and growing
- Micro's: limited distribution, although providing wider variety of choices.
- 2,822 breweries in the USA (2013). 2,768 designated as "craft breweries" (craft brewery--no more than 6 million barrells per year)(54 "big boys")
- Microbreweries: 7.8% of the beer volume in 2013 (up from 6.5% in 2012, 5.7% in 2011, and 4.4% in 2009)
- 13.2 million barrels (31 gallons/barrel)
- Overall beer market up 1% for 2011-2012.
- Microbrewery sales: for 2013: $14.3, 14.3% of the beer market (up from 2012: $10.2 billion and $8.7 in 2011). Total beer market for 2013: $100 billion (up from $99 in 2012)
- Local: Schlafly: 56,000 barrels in 2013 (up from 49,442 barrels in 2012). O'Fallon: 9,500 in 2013 (down slightly from 2012). Urban Chestnut: 6,500 barrels in 2013. 6th Row: 1,200 barrels in 2012
- Source: STL Post, 3/19/13, page A9 (Lisa Brown reporting) and STL Post 3/18/14
- Per Capita Consumption
Beer and culture: (a new section just getting started)
- Oldest form of alcohol?
- Today, highly mechanized production
- But, still lots of small traditional vintners
- American vines brought from Europe. In the late 1800's, and again in the 1960's; massive disease destroyed many of the European (France, Spain, Italy) vines, so the American vines were re-introduced.
- Wines.com (searchable database!)
Types
- Generics: European names, but blended (Chablis, Rhine, etc)
- Varietals: 51% of a specific grape. Individual bottles.
- Red wine: leave skin on during fermentation
- White: white grape, skin off
- Rose': leave skins for a couple of days, generics- mix red and white.
- Blush: juice of particular grapes is dark enough (Zinfandel)
- Sweet vs. Dry: sugar content, Sweeter wines are heavier- sweetness overrides harsh flavors.
- Dessert wines: special grapes or processing ("Eiswein" (in Canada), "Auslese," "Trockenbeerenauslese")
- Bottling Wine in Germany
Other Variations
Fortified wines
- Spain: add brandy- kills yeast, stops fermentation, and wine will not spoil.
- Seal in charred oak casks- refines taste: "Sherry"
- Others: "Muscatel," "Madeira" and Port-- sweeter, after dinner drinks
- Typically 20%
Consumption
- Pre 1960- little in USA, mostly sweet and dessert
- Now, use of those varieties is in decline, others (drier) are consumed more.
- Over 2.5 gal/year (2009)
- 1980's and 1990's-- Wine Cooler: Kool-aid taste, marketed as "soft drink," 25% of wine market. Replacing beer as the "Gateway Drug."
Alcohol consumption, overall
WWW Links: Sites Relating to Alcohol Use and Consumption
Absorption and Metabolism
- Alcohol requires no digestion
- 20% is absorbed in the stomach, most through small intestine
- CO2 or empty stomach speeds absorption- etoh passes more rapidly into the small intestine.
- Alcohol is not stored by the body, the calories it provides are used first- tied to weight gain (you gain weight from the food you eat along with the alcohol)
- Fat cells versus muscle cells (alcohol is water soluble): Males vs. Females
- 90% metabolized by liver
- 2% excreted: urine, breath
- Enzyme: Alcohol Dehydrogenase: Alcohol=> acetaldehyde [toxicity] (acetaldehyde (aldehyde) dehydrogenase) => acetate (derivative of acetic acid). Used as fuel by cells.
- Most drugs, if consumed at high levels, metabolized at high levels.
- Alcohol--relatively steady metabolism: 100 milligrams of alcohol per kilogram of body weight. About .33 oz. (about one drink) per hour. Constant.
- Some note of a second enzyme (microsomal ethanol-oxidizing system [MEOS]) that is associated with chronic, heavy drinking-- permanent: speeds up metabolism.
- Stimulants: coffee, etc==> no effect
- Chronic use- destroys liver- impedes metabolism of other drugs
Impact on CNS
Acute Objective effects
- General Anesthetic
- Depressant
- Used until 1800's in surgery: replaced by nitrous oxide. Problem in controlling the effect of alcohol. Effective dose-- close to lethal dose. Slows blood clotting.
- Tied to GABA receptor complexes in the brain. Similar to neurotransmission processes that relate to an understanding of benzodiazepines.
- GABA produces an inhibitory function in the brain's neural processing. Seems alcohol and drugs like Valium enhance this activity.
- Hoffman-LaRoche labs: RO 15-4513 ?? "Sober-up" pill ??
- Number of grams of Alcohol per 100 ml. blood. (100mg./100ml. = .10% BAL)
- At lowest effective doses: Poorly learned behaviors deteriorate; at higher levels: inhibitions decline and behaviors elevate, critical thinking also declines
- The quicker the volume of etoh increase, the greater the effect, yet modified by "Behavioral Tolerance"
- Vomiting likely at .12%, especially if reached quickly.
BAL | Effect |
.03 | Dull and dignified |
.05 (~2 beers in one hour) | Dashing and debonair |
.1 (~4 beers in one hour | Dangerous and devilish |
.2 | Dizzy and disturbing |
.25 | Disgusting and disheveled |
.3 | Delirious and disoriented |
.35 | Dead drunk |
.6 (~one quart of whiskey in one hour) | |
(adapted from Bogen in Ray and Ksir, 8th ed. 1999, p. 222)
- BAC Calculator (another)
- BAC of .4==> LD50, BAC .8==> LD100
- 1 drink= ~ .5oz alcohol
- DWI: ~3 drinks in one hour, all other things equal
- 1 drink every hour (sipping): Theoretically "no problems" (normal liver)
- 6 drinks over 2 hours=> ~4 drinks in system: at least .1% BAL
- Rule of equivalency (a drink is a drink):
- 1-12 ounce (5%) Beer =1-4 ounce glass of wine (15%)= 1 ounce of (80 proof) distilled spirits
Other Acute Objective Effects
- Blackouts: mechanism is questionable
- Sexual behavior:
- Increases desire=> Expectancy (cultural conditioning)
- Decreases capacity
- For males: lowers testosterone levels
- Aggression:
- Testosterone drop=>
- Increase in Lutenizin (hormone)
- Lutenizin=> direct impact on aggression/sex centers of brain
- Peripheral Circulation increases, Core temperature drops
- Fluid balance: suppresses ADH (anti-diuretic hormone)
- "You don't buy beer, you only rent it" (Archie Bunker)
- Link to hangover
- Hangovers
- Germans: "wailing of cats" (Katzenjammer), French: "woody mouth" (gueule de boise), Swedes: "pain in the roots of my hair" (hont i haret) (Ksir, Hart, and Ray, Drugs, Society, and Human Behavior, 12th ed, 2008, page 220).
- Element of withdrawal
- Effect of congeners
- Irritation, especially gastro-intestinal tract
- Blood sugar levels
- Dehydration
Chronic Objective Effects
- Brain:
- Alcoholic Dementia; intellect down, difficulty with low level skills- swallowing, manipulating small objects
- Wernicke-Korsakoff Syndrome; deficiency of thiamine: Confusion, Difficulty walking, Abnormal eye movements, and Korsakoff's Psychosis: inability to remember recent events or learn new information.
- Withdrawal: Stages
- Tremors, increase heart rate, insomnia
- Hallucination,
- Delusions: Delirium Tremens, amnesia
- Seizures, death possible
- Chronic diseases: Malnutrition, "Body disease"
- Liver disorder
- Fatty liver (metabolizing of etoh, prevents processing)
- Alcoholic hepatitis
- Cirrhosis
- Heart Disease:
- Damage to heart muscle
- High blood pressure
- Strokes
- Moderate use factor in lower rates of above: Increases HDL "good cholesterol"
- Cancer:
- Mouth
- Tongue
- Pharynx
- Larynx
- Esophagus
- Stomach
- Liver
- Lung
- Pancreas
- Colon
- Rectum
- Immune System Dysfunction
- HIV: Sexual behavior, Immune system
- Fetal Alcohol Syndrome:
- Growth retardation
- Pattern of abnormal features: head size, nose, etc.
- CNS abnormality
- Variety of other effects
- "Maternal alcohol abuse may be the most frequent known environmental cause of mental retardation in the western world." (Oakley Ray, 1993)
- Heavy Drinkers Live Longer than Nondrinkers (2010)(local copy)
Other Effects: Alcohol worse than heroin and cocaine?
Subjective Effects
- Little doubt that when consumed in sufficient quantities, there is significant impairment.
- But: in most cases subjective effects seem to be dependent on who happens to be drinking and where.
Aggression and Violence
- Yuruma (S. Am. Rain forest): Withdrawn
- Japan (Takashima): Laughter and Song
- Aritama (Mestizos, Columbia): Somber, morose, controlled, rigidly serious- Regardless of BAC
- Camba (Bolivia): Drink 180 proof. Early- happy; later- stupefied, stare at ground. Total lack of any form of aggressiveness.
- Cross and inter-cultural influences
- Pipage (desert dwelling North Am): Cactus wine during rainy season- drink till drunk and vomit; no fighting. After contact with whites and ready availability of etoh- violence
- Bantu (S. Africa): Tribal setting- peaceful. Urban- violent
- Rural Okinawa: Sake (2 type of use) Male only- anger and violence; Male and female- no aggression
- As circumstances change, so to does drunken comportment
Sexual Behavior: Same patterns and variations
- Camba: rigidly puritanical
- Tarhumana (Mexico): typically chaste and timid; Drunk- wife swapping
- Lepcha (Sikkim)(see this): Most sexually active people around. Adultery common and expected. Sex is main topic of conversation. Harvest festival: drink lots, "unbridled promiscuity," linked to better harvest. Yet, incest taboo (4th cousins, any in-law, blood relatives on father's side for 9 generations.....) Is never broken.
- Time, Place, and Object Selectivity==> violence and sex under the influence.
- "Respect" for socially defined limits
- Behavior is not fixed, Drug use is a part of understanding behavior
- In the USA: Enormous range, Lots of violence=> Viewed as "legitimate."
- The "Socially organized character of drunken comportment"
Consumption and Control in the USA
- Native Americans (pre-Columbus): Beer
- Pilgrims stopped at Plymouth (1620)==> Out of Beer
- Arabella (later ship): 10,000 gallons of wine, 42 tons of beer, 14 tons of water
- Alcohol was not a luxury, but considered a necessity
- 1673- Increase Mather: Warned of too much use, but considered alcohol good in itself.
- Colonial drinking: Frequent and Heavy
- Utilitarian
- Meals
- Children
- At work
- Politician and votes
- Normal ration in army
- Exception 1784- Benjamin Rush: Alcoholism as a disease
- 1790: 5.8 gallons of grain spirits per person (2x current)
- Use rarely viewed as problematic: Family and community control
- Drinking: Matter of Choice (Drunk==> Sinner, Poor Choice==>Punish)
- First Temperance Society- 1808
- 1826: American Society for Promotion of Temperance: Moderation
- Use rose in 19th Century- 1830: 7.1 gallons=> more distilled. Viewed as vital to health and well-being (even for school children)
- 1830: National Movement- Abstinence (1.5 million members), success at limiting use in some settings.
- 1840: 3.1 gallons
- 1850-1920: Decline (except for Civil War years)
- "Respectable" people: likely to oppose its use (no moderation- abstain or drunk)
- Lower classes and new ethnics: approve (Drinker==>Threat==>Enemy)
- 1900: 2 gallons
- 1920: 2.5 gallons
.jpg)
(http://commons.wikimedia.org/wiki/File%3A5_Prohibition_Disposal(9).jpg)
- Feasibility of enforcement
- Thought it would automatically reduce drinking
- Variations and exceptions
- Seen as a solution to a variety of problems
- "Temperance, Prohibition, Alcohol Control" (Harry G. Levine and Craig Reinarman, FROM PROHIBITION TO REGULATION: LESSONS FROM ALCOHOL POLICY FOR DRUG POLICY).
- Status Struggle: Deviance and Moral Entrepreneurs
- Supporters: Rural, native-born (Nativism), white-collar/middle-class, farmers and land owners, Protestant.
- Opponents: Urban, immigrants, labors, Catholic.
- Prohibition represented the values of the "Ascetic, Protestant Middle-Class." (Gusfield)
- The drinker as deviant was redefined from Sinner=> Enemy (and since prohibition,=> Sick). Control the cultural behavior of the threatening group and control the group itself.
- Problem of Social Change (1920-1933)
- Old middle-class lost prestige
- Urban dwellers found increasing mobility and political power
- A "new" middle-class emerged: Industrialization- Urban, cosmopolitan, college educated, technically trained.
- Old entrepreneurial capitalists lost hold to the new managerial class
- New middle class viewed drinking as recreation
- Symbolic aspect of abstention declined
- Business involvement
- Means of controlling and regulating workers- Power Elite
- But, failure of prohibition: Massive law violation=> undermined authority=> repeal= Co-optation
- By 1933 the Volstead Act had become so unpopular- no one wanted it.
- Ohio State's Temperance and Prohibition resources
- Minnesota Historical Society resources
 Lessons
- Problems of lack of regulation- Licensing and state regulation now control central elements of production and distribution
- Question the effectiveness of Criminalization
- Alcohol Control after Prohibition: See "Shedding a Tier" from the St. Louis Post-Dispatch (4/28/05) for an account of contemporary revisions to the policies put in place to control alcohol production and sale after prohibition.
Prohibition Resource Page: http://www.authenticwinecountry.com/Prohibition
Use Today
Alcohol Justice: The Alcohol Industry and Policy Database
| Gallup poll (local copy) | 1939 | 1947 | 1976 | 1990 | 2010 |
| Drinker (last year) | 58% | 63% | 71% | 57% | 67% |
| abstain | 42% | 37% | 29% | 43% | 33% |
- 2000: 47% report having used alcohol in the past month, 20% listed as binge drinkers.
- 2005: 51.8%
- Slightly more than half (52.1 percent) of Americans aged 12 or older reported being current drinkers of alcohol in the 2012 survey, which was similar to the rate in 2011 (51.8 percent). This translates to an estimated 135.5 million current drinkers in 2012. (2012 NSDUH)
- Nearly one quarter (23.0 percent) of persons aged 12 or older in 2012 were binge alcohol users in the 30 days prior to the survey. This translates to about 59.7 million people. The rate in 2012 was similar to the rate in 2011 (22.6 percent). (2012 NSDUH)
- In 2012, heavy drinking was reported by 6.5 percent of the population aged 12 or older, or 17.0 million people. This percentage was similar to the rate of heavy drinking in 2011 (6.2 percent). (2012 NSDUH)
- Most Drinking: Lighter drinks (wine and beer), far less distilled spirits.
- 21 year old laws in all states (1979 only 14): Impact- significant, fewer children and teens drinking (although no longer declining), Auto deaths down- 25-30% correlated with alcohol use (1990-50%).
- Current MTF Data
- Current National Survey on Drug Use & Health
Drinking in the USA
Goode, Erich. 2014. Drugs in American Society, 9th edition. McGraw-Hill: St. Louis
Substance Abuse and Mental Health Services Administration, Results from the 2013 National Survey on Drug Use and Health: Summary of National Findings, NSDUH Series H-48, HHS Publication No. (SMA) 14-4863. Rockville, MD: Substance Abuse and Mental Health Services Administration, 2014.
| SES | % of Households (2010 data: Gallup poll) |
| Over $75,000 | 81% |
| $50,000-75,000 | 78% (more frequently, too) social expectations? |
| $30-50,000 | 66% |
| $20-30,000 | 51% |
| Under $20,000 | 46% (18% regularly) |
- Education: Higher the level of education, more likely to drink regularly--rates are increasing in recent years
- 2013 NSDUH:
- Among adults aged 18 or older, the rate of past month alcohol use increased with increasing levels of education. Among adults in 2013 with less than a high school education, 36.5 percent were current drinkers. In comparison, 69.2 percent of college graduates were current drinkers.
- Among adults aged 18 or older, rates of binge and heavy alcohol use varied by level of education. Among adults in 2013, those who had graduated from college were less likely than those with some college education but no degree to be binge drinkers (23.1 vs. 26.4 percent) or heavy drinkers (6.0 vs. 7.6 percent).
- Young adults aged 18 to 22 who were enrolled full time in college were more likely than their peers who were not enrolled full time (i.e., part-time college students and persons not currently enrolled in college) to report current, binge, or heavy drinking. Among full-time college students in 2013, 59.4 percent were current drinkers, 39.0 percent were binge drinkers, and 12.7 percent were heavy drinkers. Among those not enrolled full time in college, these rates were 50.6, 33.4, and 9.3 percent, respectively.
- The pattern of higher rates of current alcohol use, binge alcohol use, and heavy alcohol use among full-time college students compared with rates for others aged 18 to 22 has remained consistent since 2002.
- Binge Alcohol Use among Adults Aged 18 to 22, by College Enrollment: 2002-2013
2005 NSDUH: Among adults aged 18 or older, the rate of past month alcohol use increased with increasing levels of education. Among adults with less than a high school education, 36.7 percent were current drinkers in 2005, significantly lower than the 69.4 percent of college graduates who were current drinkers. However, among adults aged 26 or older, binge and heavy alcohol use rates were lower among college graduates (18.9 and 4.9 percent, respectively) than among adults who had not completed college (21.9 vs. 6.0 percent, respectively).
- College: Young adults aged 18 to 22 enrolled full time in college were more likely than their peers not enrolled full time (i.e., part-time college students and persons not currently enrolled in college) to use alcohol in the past month, binge drink, and drink heavily. Past month alcohol use was reported by 64.4 percent of full-time college students compared with 53.2 percent of persons aged 18 to 22 who were not enrolled full time. Binge and heavy use rates for college students were 44.8 and 19.5 percent, respectively, compared with 38.3 and 13.0 percent, respectively, for 18 to 22 year olds not enrolled full time in college.
- The pattern of higher rates of current alcohol use, binge alcohol use, and heavy alcohol use among full-time college students than the rates for others aged 18 to 22 has remained consistent since 2002.
Current National Survey on Drug Use & Health
- Gender:
- In 2013, an estimated 57.1 percent of males aged 12 or older were current drinkers, which was higher than the rate for females (47.5 percent). Among youths aged 12 to 17, however, the percentage of males who were current drinkers (11.2 percent) was similar to the rate for females (11.9 percent). The rates for male and female youths were lower than those reported in 2012 (12.6 and 13.2 percent, respectively).
- Among young adults aged 18 to 25, an estimated 62.3 percent of males and 56.9 percent of females were current drinkers in 2013. In this age group, 44.4 percent of males and 31.4 percent of females reported binge drinking in 2013. In 2013, the rate of binge drinking among females aged 18 to 25 was lower than the rate reported in 2012 (33.2 percent). The rate of binge alcohol use in 2013 among males in this age group was similar to the rate in 2012 (45.8 percent).
- Binge Alcohol Use among Adults Aged 18 to 25, by Gender: 2002-2013
1999 NHS:
- With the exception of adolescents, males were more likely than females to report past month alcohol drinking. In 1999, 54.0 percent of males (ages 12 and older) were current drinkers compared to 41.1 percent of females.
- For the youngest age group (12 to 17), males and females had comparable rates of current alcohol use (19.2 percent of males and 18.1 percent of females).
- Among pregnant women age 15-44 years, 13.8 percent used alcohol and 3.4 percent were binge drinkers. These rates are substantially lower than the rates for nonpregnant women of that age (49.3 percent and 19.4 percent, respectively).
2005: 58.1 percent of males aged 12 or older were current drinkers, higher than the rate for females (45.9 percent). However, among youths aged 12 to 17, the percentage of females who were current drinkers (17.2 percent) was higher than that for males (15.9 percent).
Current National Survey on Drug Use & Health
- Religion (see also: James B. Holt, Jacqueline W. Miller, Timothy S. Naimi and Daniel Z. Sui. 2006. Religious Affiliation and Alcohol Consumption in the United States. Geographical Review , Vol. 96, No. 4 (Oct., 2006), pp. 523-542. Article Stable URL: http://www.jstor.org/stable/30034136.
| Religion | Percentage | Problems |
| Judaism | Most drink | relatively few problems for those who drink |
| Non-Christian | 80% | |
| No religion | 80% | |
| Catholics | 78% | |
| Protestants | 61% | |
| Southern Baptist | 55% | Many problems attached to those who drink |
| East Coast | 54.0% |
| West Coast | 50.7% |
| Midwest | 55.7% |
| South | 48.2% |
- Age (NSDUH 2013):
- In 2013, rates of current alcohol use were 2.1 percent among persons aged 12 or 13, 9.5 percent for persons aged 14 or 15, 22.7 percent for 16 or 17 year olds, 43.8 percent for those aged 18 to 20, and 69.3 percent for 21 to 25 year olds. The estimates for persons aged 14 or 15 and those aged 16 or 17 were lower than those reported in 2012 (11.1 and 24.8 percent, respectively).
- Among older age groups, the prevalence of current alcohol use decreased with increasing age, from 67 percent among 26 to 29 year olds to 53.1 percent among 60 to 64 year olds and 41.2 percent among people aged 65 or older.
- Rates of binge alcohol use in 2013 were 0.8 percent among 12 or 13 year olds, 4.5 percent for 14 or 15 year olds, 13.1 percent for 16 or 17 year olds, 29.1 percent for persons aged 18 to 20, and peaked at 43.3 percent for those aged 21 to 25. The estimates for persons aged 14 or 15, 16 or 17, and 21 to 25 were lower than those reported in 2012 (5.4, 15.0, and 45.1 percent, respectively).
- Rates of heavy alcohol use in 2013 were 0.1 percent among 12 or 13 year olds, 0.7 percent for 14 or 15 year olds, 2.7 percent for 16 or 17 year olds, 8.5 percent for persons aged 18 to 20, and peaked at 13.1 percent for those aged 21 to 25. The estimates for persons aged 18 to 20 and 21 to 25 were lower than those reported in 2012 (10.0 and 14.4 percent, respectively).
- The rate of current alcohol use among youths aged 12 to 17 was 11.6 percent in 2013. Youth binge and heavy drinking rates were 6.2 and 1.2 percent, respectively. The rates for current and binge youth alcohol use were lower than those in 2012 (12.9 and 7.2 percent, respectively).
- In 2013, the rate of current alcohol use was 59.6 percent among young adults aged 18 to 25, which was similar to the rate in 2012 (60.2 percent). The rate of binge drinking in 2013 was 37.9 percent for young adults. Heavy alcohol use was reported by 11.3 percent of persons in this age group. The binge and heavy drinking rates were lower than the rates in 2012 (39.5 and 12.7 percent, respectively).
- The prevalence of current, binge, and heavy alcohol use in 2013 was lower among adults aged 65 or older (41.7, 9.1, and 2.1 percent, respectively) than among all other adult age groups. These rates among adults aged 65 or older were similar to the current, binge, and heavy drinking rates in this age group in 2012 (41.2, 8.2, and 2.0 percent, respectively).
Current, Binge, and Heavy Alcohol Use among Persons Aged 12 or Older, by Age: 2013
- African Americans: High abstinence, low rate of heavy drinking, high risk of problems
- Hispanics: High abstinence, high rates of heavy drinking, high rates of problems
- Asians: Highest rate of abstainers, lowest rate of heavy drinking, lowest rate of problems ("Flushing")
- Native Americans: Great deal of variation, extremely high rates of problems
- Whites: High use rates. Heaviest: Irish (most likely to drink and high rate of problems) Italians, Northern WASPs, Slavs, Germans. Low rates: Latins and Southern Whites.
- 2013 NSDUH:
- Among persons aged 12 or older, whites in 2013 were more likely than other racial/ethnic groups to report current use of alcohol (57.7 percent). The rates were 47.4 percent for persons reporting two or more races, 43.6 percent for blacks, 43.0 percent for Hispanics, 38.4 percent for Native Hawaiians or Other Pacific Islanders, 37.3 percent for American Indians or Alaska Natives, and 34.5 percent for Asians.
Current, Binge, and Heavy Alcohol Use among Persons Aged 12 or Older, by Race/Ethnicity: 2013
Alcoholism
- Defining the alcoholic:
- Quantity/Frequency: 5oz.; ? Of individual variation, Moderate drinkers and problems; binge drinkers.
- Psychological Dependence: Vague; Testing?; Signs?-- Answering yes to how many?
- Physical Dependence: OK, but restrictive.
- Life-Problems: Social setting; Who's defining?; Heavy use vs. No "objective" problems?
- Models
- Moral: Free will; choice; lack of control; punish and therapy
- Medical: Uncontrollable; Disease; Bio-genetic; Recover vs. Cure; Alcoholic=> different from moderate drinker. Seems applicable to some (twin studies, COA)
- Essential Difference? (TIQ, genetic marker?)
- Stages or Career
- Jellineck: Alpha--inadequate, Beta-social dependence, Gamma-typical: emotional impairment, Psi-physiological, Delta-maintenance (sips all day), Epsilon-binge, Zeta-moderate, but problems when use.
- One style does not fit all.
- Supreme Court (1989): Not a disease (cannot be used as excuse--Vets and benefits).
- DSM-IV: abuse or dependence
- DSM-V: Alcohol Use Disorder (see NIAA and criteria)
- Behavioral: Social learning, reinforcement, and socio-cultural values/attitudes. Family structure and dynamics: Exposed early- diluted and small quantities- in conjunction with meals- abstaining accepted. Parents model appropriate use- heavy use unacceptable. No moral importance attached to use: Not proof of adulthood. Agreed upon "ground rules."
- Self-definition.
- Expectations.
- Social norms
- Early Cure?
- Is Alcoholism Reversible?
- Moderate Drinking for the Alcoholic?
- Abstention as deviant in many setting
- Doesn't work for all
- How many (~30%): Practical issues and treatment?
- RAND study (1976)(8 treatment center, chronic users-9 times typical drinker)
- At 18 months 70% improved: controlled use (even though abstinence was treatment goal).
- At 4 years 41% of controlled had relapses, 30% of those who had abstained.
- Yet, majority of those who were controlled stayed that way.
URL: http://www.umsl.edu/~keelr/180/alcohol2.html
Owner: Robert O. Keel rok@umsl.edu
References and
Credits for this Page of Notes
LastFriday, November 17, 2017 3:43 PM->->->->->->->
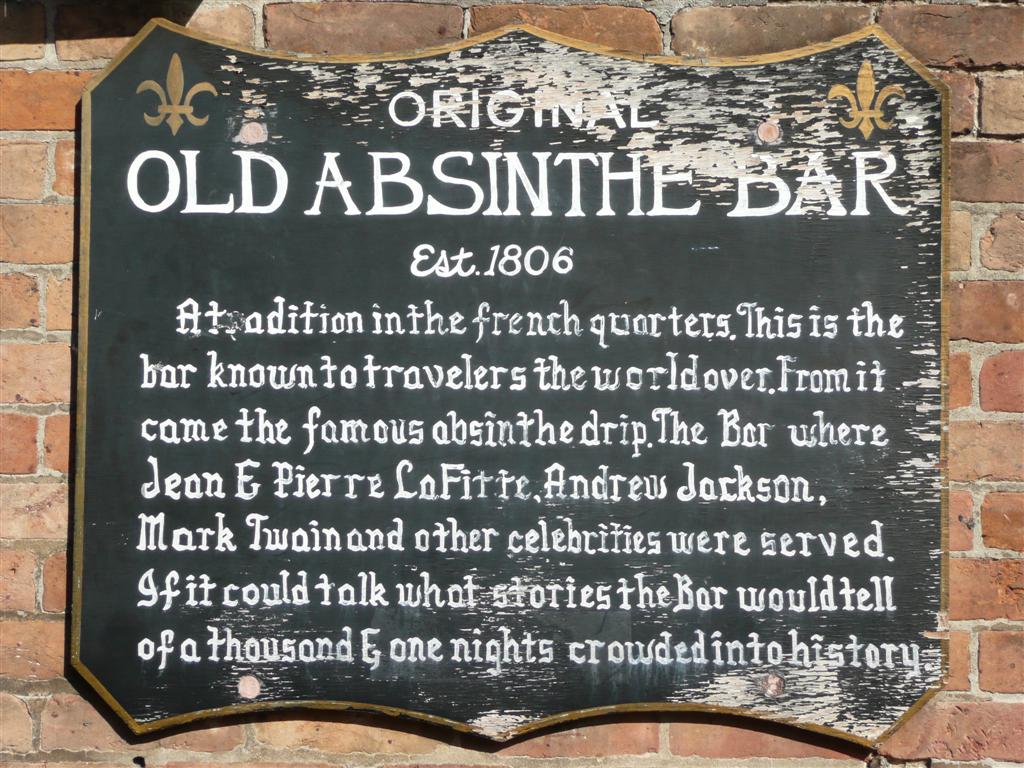
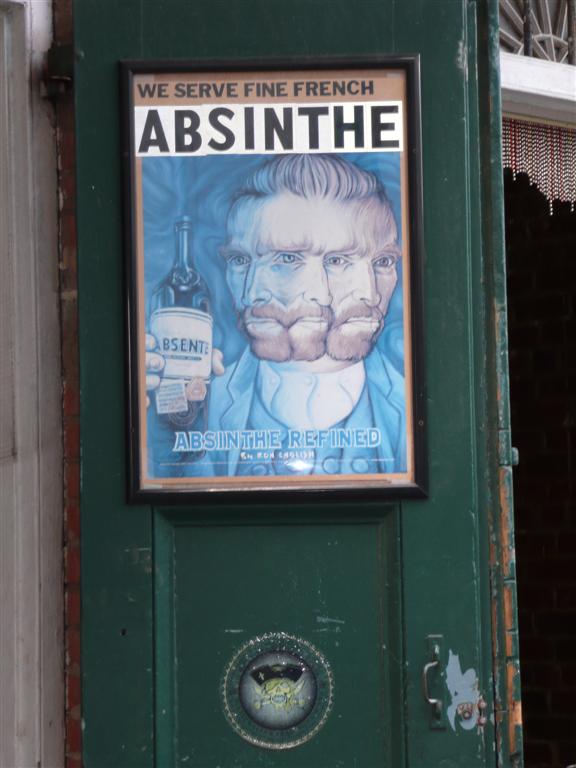 (see also: Erowid) (The Old Absinthe Bar in New Orleans))
.jpg)