Introduction
Data modeling, a way to structure and organize data, is wildly applied
in different industries because it can be used easily by databases.
Early modeling and analysis help companies to understand their needs
and problems with potential solutions. According to American National
Standards Institute (ANSI for short), data models can be a conceptual
model, a logical model, or a physical model. In real business world,
since the goal of modeling always changes, the data modeling turns out
to be very important, especially in the early designing phase (Muller,
2009). Also, during the process, communication and precision are two
key benefits that make a data model crucial.
This paper will discuss what kind of role data modeling plays in system
analysis, what a high level data model is, why it is important in
system analysis, and how agile data modeling develops in system
analysis.
What is data modeling?
Data model is created as representation of the information
requirements of an organization. Data model functions as an effective
communication tool for discussions with users; it also serves as a
blueprint for the database system. A data model, therefore, acts as a
bridge from real work information to database storing relevant data
content. Blueprints are created at several different levels of detail;
from the high-level requirements, to the basic architectural layout or
to the detailed wiring and plumbing designs.
The blueprint analogy is often used because there are many
parallels between blueprints, which many people are familiar with, and a
data model, which few people outside of IT have seen. The most obvious
parallel is that a blueprint translates a very complex and technical
undertaking into a set of visual diagrams that a layperson can
understand (Hoberman, Burbank and Bradley, 2009). This is the goal of a
data model.
Origins of Data Modeling
About forty years ago, the early days of data processing, the
entire focus of system development revolved around automating tedious
manual business processes. The elimination of slow manual processes was
the key driver. During the system development life cycle (SDLC for
short), the main effort was to produce a set of programs that automated
a business process (Kabeli and Peretz, 2003).
With the development of technology, the complex changing
business environment increase the complexity of information system,
which makes the old way of conducting the information system analysis
hardly to satisfy the current and future requirements ( Zhenfeng and
Lin, 2009).
Nowadays, the system analysis process consists of two main
activities: data modeling and functional modeling. While traditional
development methodologies usually emphasize functional modeling through
dataflow diagrams (DFDs), object-oriented (OO) methodologies emphasize
data modeling through class diagrams (Kabeli and Peretz, 2003).
The role of data modeling in system analysis
One question first came into my mind is why we model data. The
goal of the data model is to make sure that the all data objects
required by the database are completely and accurately represented.
Because the data model uses easily understood notations and natural
language, it can be reviewed and verified by the end-users.
The data model is also important to the database developers who
employ it as a "blueprint" to build the physical database. The
information contained in the data model will be used to define the
relational tables, primary and foreign keys, stored procedures, and
triggers. A poorly designed database will require more time in the
long-term (Webpage, zazanetwork.com). Without careful analyze the
system, you may create a data model that omits data required to create
critical reports, produces results that are incorrect or inconsistent,
and is unable to accommodate changes in the user's requirements. If
your data model is wrong, your application might not do what users
want.
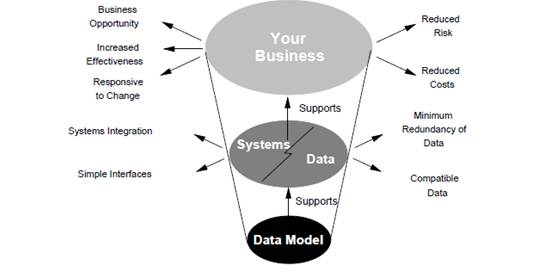
Figure How data models deliver benefit
What makes data modeling important?
There are two core characteristics of a data model that make it
so valuable: communication and precision (Blaha, 2007). Because data
model is a representation of the information requirements of an
organization, it must truly reflect the data requirements of an
enterprise. Every aspect of the data of the company’s business
operations must be indicated clearly and precisely in the data model. A
data model serves as a means for communication with users or domain
experts. It is also a blueprint for the proposed database system for
the organization. The design and analysis of the system must focus on
these two aspects.
Data models at information levels
In Hoberman’s book (Data Modeling for the Business),
he used a hypothetical example to explained what the data models at
different information levels would look like. In his example, he asked
his architect to design a small vacation home with a nice front porch.
In his house example, he applied several layers of diagrams: a very high-level data diagram (also called External Data Model) to align on the scope of the project (Figure 1 and Figure 2), a high-level picture to ensure that we had the same vision of the house (Figure3- conceptual level), then a more detailed layout of the architecture or (Figure 4- logical level), and finally a detailed, technical design diagram of the physical infrastructure (Figure 5- physical level).
External Data Model (Very high level picture)
The external data model is a depiction of the database system from the viewpoints of individual user groups. An external model (or view) looks at the world from a particular perspective, for a particular purpose. There are many possible external views of the world: they may overlap, and do not have to be compatible. In particular, external views are an appropriate place to hold the data requirements for a particular business context and the rules that apply to it. The data models of most applications today take a view of the world from the perspective of that application, and so are external models (Ponniah, 2007).

Figure 1 – A small, Wooden House with a Front Porch (Very high level)
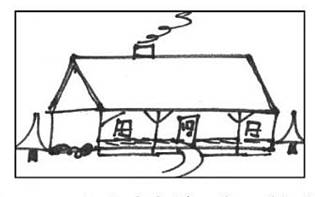
Figure 2- A small, Wooden House with a Front Porch (Very high level)
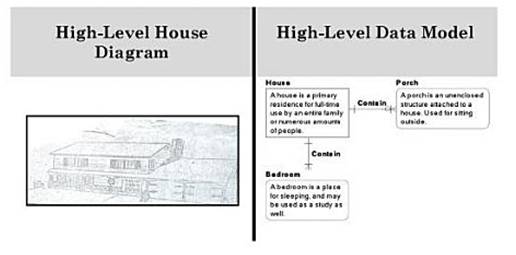
Figure 3 - Blueprint and Data Diagram at a High Level (Architect’s Sketch of House)
In the example above in Figure 3, the architect drew a
high level picture to show what he had in mind for the house – that it
would have a front porch, be big enough to sleep a large number of
people, etc. For data, we use a high- level data model
(which is also called conceptual data model) to clarify what
information is important, how basic concepts are defined, and how these
concepts related with each other. The high level picture helps
gathering business requirements and clarifying understanding of basic
concepts.
The conceptual data model is at a high and general level
intended mainly as a communication tool with the user community. It is
also considered as a diagram identifying the business concepts
(entities) and the relationships between these concepts in order to
gain, reflect, and document understanding of the organization’s
business, from a data perspective. The conceptual data model is
important and widely used in the early stage of requirements analysis
for information systems (Tang and Zhao, 2009, page 37). The
construction of a conceptual data model in the early stage of software
development is quite commonly practiced among industries.
A Conceptual data model usually takes the form of an Entity
Relationship Diagram (ERD) or Object Role Model (ORM). The conceptual
data model typically does not contain attributes. Some scholars also
consider conceptual data model like a picture on the puzzle box
that provides the vision of what the information puzzle should look like
at the end of the day, regardless of whether your solution is a Data
Warehouse, SOA, ERP, Master Data Management, or OLTP (web source,
Stiglich).
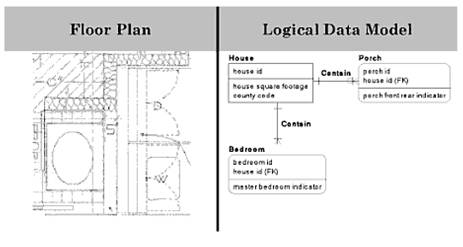
Figure 4 –Data Diagram at the logical level
In logical level, for the building architect,
this means drawing out detailed floor plans to show the layout of the
house, the size and function of the rooms, and how the rooms fit
together. In data modeling, we have more detailed levels of the diagram
to show the layout of the data, the size and type of the data, and how
various objects related to each other (Hoberman, Burbank and Bradley,
2009).
The logical level shows more details while incorporating
business logic and business rules. A logical data model is normally
created by a data modeler or data architect, but a business person
needs to be heavily involved to make sure that the rules and definitions
are represented correctly (Hoberman, Burbank and Bradley, 2009).
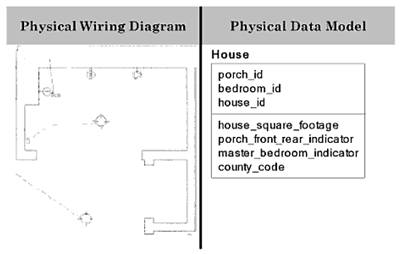
Figure 5 – Data Diagram at the Physical Level
The physical level indicates the technical
details for implementation as a database or data structure. In practice,
physical model represents a way in which data is physically stored.
There may be many valid physical models for a conceptual model. The
requirement is that a physical model must be able to support the
conceptual model.
In practice, the data models in different information levels
would also show as below. There are several data models at the various
levels of information- external data model, conceptual data model,
logical data model, and physical data model. Figure 6 shows the data
models at different information levels (Ponniah, 2007).
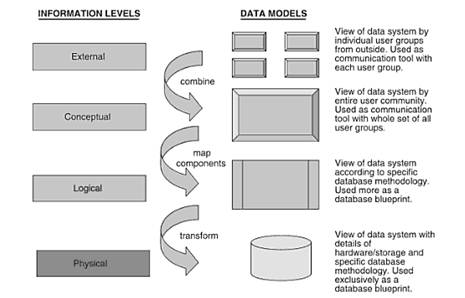
Figure 6 - Data models at different information levels (Ponniah, 2007)
Compare Top-down approach with Bottom-up approach
The top-down approach of starting with a very high level design
and moving successively into more detail is one way of looking at data
design in an organization (Hoberman, Burbank and Bradley, 2009). This
approach begins with purely a business need perspective. For example, if
a new system is built from scratch and there were business experts
eager to participate in the project, a top-down approach would be
appropriate. The business should aim for the whole picture. Ideas are
accepted even if you know there is no way to deliver the requirement in
today’s application environment. You build an initial high-level data
model by studying the systems that the business is using today. It can
include operational systems that run the day-to-day business or it can
contain reporting systems that allow the business to view how well the
organization is doing.
The bottom-up approach, on the other hand, temporarily ignores what the
business needs and instead focuses on the existing systems
environment. Sometimes, we are often building on top of existing
systems, it’s more common to start from the bottom-up approach which is
similar to trying to visualize what the house is supposed to look like
when only the physical wiring diagrams are shown (Hoberman, Burbank
and Bradley, 2009). In practice, if there is minimal business resources
available and ample systems documentation, and the purpose of the
model is to understand an existing application, a bottom-up approach is
ideal (Burbank, 2010).
Considering the system analysis process is a constant loop of
reconciling what the business needs with what information is available,
many companies employed hybrid approach now. The hybrid approach is
iterative and usually completes the initial information gathering step
by starting with some top-down analysis and then some bottom-up
analysis, and then some top-down analysis, etc., until the information
gathering is complete. For instance, if a new system is being planned,
or an upgrade to an existing system and business expertise is available
and required, a hybrid approach is best (Burbank, 2010).
A high level data model conveys the core concepts and principles of an organization in a simple way, using concise descriptions (Hoberman, Burbank and Bradley, 2009). The key to a high level data model is simplicity. But it should be clear enough so that a nontechnical person can understand it. In another word, the purpose of the high level data model is to describe complex information in a simply way, using a concise description, not a vague one. One of the advantages of developing the high level model is that it facilitates arriving at common terminology and definitions of the concepts and principles.
Creating a common understanding, common goals, scope and context of core concepts of the business across functional areas is critical to system analysis and the future success of data management. It is important to information systems analysis that managing the data in organizations by understanding of information and the business rules that define your organization.
The Data Modeling Integration
The concept of linking or mapping among different design levels is critical to data modeling. The ability to link your high level data models to the lower level data models that control your business rules and ultimately the database systems that run the organization is the key to this integration (Hoberman, Burbank and Bradley, 2009). In a typical data warehouse implementation, once you have established the logical data model, you still need to spend a significant amount of time in designing and building aggregates, joins, views, star schemas, etc.
Agile Development and Data ModelingAgile software development challenges the traditional way of software development and project management. Continuous customer-centric requirements reprioritization is essential in successfully performing agile software development (Racheva and Daneva, 2010). In rapidly changing environments, changing requirements and tight schedule constraints require software developers to take a different approach toward the process of software development (Cao, 2005).
The historical benchmark of best practices is known as the “waterfall approach” to software projects. The waterfall approach was originally described by Winston Royce in a 1970 paper (Royce, 1970) on managing the development of large software systems. Its recommendations would be familiar to most simulation practitioners as it features the more-or-less traditional steps of Requirements, Design, Construction, Integration, Testing, Installation and Maintenance. One of the biggest complaints of the Waterfall methodology is a lack of communication with the customer beyond the introductory stages. This organized and methodical approach has been successful in the construction of complex, mission-critical software applications in many industries. However, the waterfall approach has been criticized over the years (Parnas & Clements 1986; Weisert 2003) for being inflexible, and other development methodologies have emerged as a response (Sawyer and Brann, 2008).
What makes the agile modeling approach appropriate for data modeling? Why not use the waterfall approach, or a modified waterfall to allow for some iteration? This is because, in the real world, the requirements for a simulation can and do change during the course of the project, and agile approaches are designed to help manage that change. The customer’s priorities may change (Sawyer and Brann, 2008).
Agile and traditional development approaches divided the software market into two competing parties; each has its strengths and weaknesses. A new proposed Hybrid model that combines both methodologies to overcome their weaknesses and make use of their strengths resulting in a mature and a professional software model ( Zaki and Moawad, 2010).
The proposed model consists of six phases 1) inception, 2) planning, 3) iterative assessment, 4) iterative building, 5) production, and 6) closure, which will be carried out starting from the project’s initiation till the final delivery as shown in figure7( Zaki and Moawad, 2010).
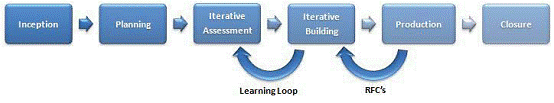
Figure 7- The Hybrid Disciplined Agile Software Process Model
The model starts with the “inception phase” that is entitled
with respect to the rational unified process (RUP) first phase, sharing
the big picture idea but differs in the details. (Kruchten, 2000) It’s
the initiation phase were all the aspects of the project is being
gathered, discussed and measured. By the end of the “inception phase”,
the team will have a good starting knowledge to build the initial high
level plan through the second phase, the “planning phase”. Building the
plan is simply prioritizing the features and assigning their effort
estimates, and finally breaking down the project into sets of
iterations. Once the plan is submitted and agreed upon, then starts the
first “iterative assessment” activity. Through the assessment activity
all the agile issues and concerns are listed and measured through the
different aspects evaluation activities of the project, which will be
elaborated in more details through the next section. The benefits
behind such assessment are customizing and disciplining the model
according to the current project’s aspects ( Zaki and Moawad, 2010).
Following this is the “building phase”, or in other words, the
“construction phase”. It is the phase where the actual work is carried
out. Each and every feature is being analyzed and built deeply. As a
single iteration ends an “iterative assessment” activity starts to
reflect the changes and tune the process. Next is the “production
phase” which is reached when the product is mature enough to face its
users. Finally, the “closure phase”, all the reaming activities are
finalized for closing the project ( Zaki and Moawad, 2010).
The software analysis process consists of two main activities: data modeling and functional modeling. While traditional development methodologies usually emphasize functional modeling via dataflow diagrams (DFDs), object-oriented (OO) methodologies emphasize data modeling via class diagrams. Agile data modeling approach using UML includes various techniques for both data and functional modeling which can be utilized in various ways. In fact, different methodologies utilize data modeling and process modeling techniques have advantages and disadvantages.
In conclusion, to the best of our knowledge, there is not any standard method or model that allows us to model all aspects of a data warehouse (Mora and Trujillo, 2004). The data model is a crucial section of the system analysis, which is the core of the data warehousing. A data model is a plan for building a database. To be effective, it must be simple enough to communicate to the end user. The data structure required by the database yet detailed enough for the database design to use to create the physical structure. In this integrated modeling environment, modelers can construct, integrate, and share new models.
In sum, determining which of the four types of data models will work should be best based on the purpose of the model and the available resources. Choosing either a top-down, bottom-up or hybrid approach, and hence, must be based on the purpose of the model and the available resources.
References
1. Moss, Larissa and Steve Hoberman: "The Importance of Data Modeling as a Foundation for Business Insight", 2004.
2. Kabeli, Judith and Peretz Shoval: "Data Modeling or Functional Analysis: What Comes Next? An Experimental Comparison Using FOOM Methodology", 2003.
3. Wu Zhenfeng and Guo Lin: "The Application Research on the Visual Data Modeling in the Information System Analysis and Design", E-Learning, E-Business, Enterprise Information Systems, and E-Government, 2009.
(EEEE '09. International Conference, pp.169-172, 5-6, Dec. 2009)
URL:http://ieeexplore.ieee.org/stamp/stamp.jsp?tp=&arnumber=5359255&isnumber=5358478
4. Muller, Gerrit: "System Modeling and Analysis: a Practical Approach." (2009): .
5. Databases-Data Modeling, zazanetwork.com, November, 10th, 2010. http://www.zazanetwork.com/resources_services/articles/databases/database_development.aspx.
6. Blaha, Michael and Bill Inmon: “Data Modeling Made Simple”, Technics Publications, LLC, 2007 USA.
7. Ponniah, Paulraj: “Data Modeling Fundamentals”, Hoboken, New Jersey: A John Wiley &Sons, INC., 2007 USA.
8. Hee Beng Kuan Tan, Yuan Zhao, and Hongyu Zhang: 2009. “Conceptual data model-based software size estimation for information systems.” ACM Trans. Softw. Eng. Methodol. 19, 2, Article 4(October 2009), 37 pages. DOI=10.1145/1571629.1571630 http://doi.acm.org/10.1145/1571629.1571630
9. Stiglich, Pete. “Necessity of Conceptual Data Modeling for Information Quality.” 13-November,-2010 URL:http://www.infoadvisors.com/ArticlesVideos/ConceptualDataModelingforInformationQuality.aspx.
10. Steve Hoberman, Donna Burbank, and Chris Bradley. 2009. “Data Modeling for the Business: A Handbook for Aligning the Business with it Using High-Level Data Models.” Technics Publications, LLC, , USA.
11. Burbank, Donna. March 25, 2010. “Creating a Successful High-Level Data Model,” 2010
http://www.information-management.com/infodirect/2009_154/data_model-10017206-1.html.
12. Lan Cao. 2005. “Modeling Dynamics in Agile Software Development.” Ph.D. Dissertation. Georgia State University, Atlanta, GA, USA. AAI3197587.
13. Sergio Luján-Mora and Juan Trujillo. 2004. “Physical modeling of data warehouses using UML.”
In Proceedings of the 7th ACM international workshop on Data
warehousing and OLAP (DOLAP '04). ACM, New York, NY, USA, 48-57.
DOI=10.1145/1031763.1031772 http://doi.acm.org/10.1145/1031763.1031772
14. James T. Sawyer and David M. Brann. 2008. “How to build better models: applying agile techniques to simulation.”
In Proceedings of the 40th Conference on Winter Simulation (WSC '08),
Scott Mason, Ray Hill, Lars M\&\#246;nch, and Oliver Rose (Eds.).
Winter Simulation Conference 655-662.
15. Parnas, D. L., and P. C. Clements. 1986. “A Rational Design Process: How and Why to Fake It,” In IEEE Transactions on Software Engineering, 12: 251-257. IEEE Press.
16. Royce, W. 1970. “Managing the Development of Large Software Systems,” In Proceedings of IEEE WESCON 26 (August): 1-9.
17. Zaki, K.M., Moawad, R. , "A hybrid disciplined Agile software process model," Informatics and Systems (INFOS), 2010 The 7th International Conference on , vol., no., pp.1-8, 28-30 March 2010
URL:http://ieeexplore.ieee.org/stamp/stamp.jsp?tp=&arnumber=5461776&isnumber=5461721
18. Racheva, Zornitza; Daneva, Maya; Herrmann, Andrea; Wieringa, Roel J.; , "A conceptual model and process for client-driven agile requirements prioritization,"
Research Challenges in Information Science (RCIS), 2010 Fourth
International Conference on , vol., no., pp.287-298, 19-21 May 2010
doi: 10.1109/RCIS.2010.5507388
URL:http://ieeexplore.ieee.org/stamp/stamp.jsp?tp=&arnumber=5507388&isnumber=5507122
19. Shaowu Cheng; Xiaofei Xu; Gang Wang; Quanlong Li; , "An agile method of modeling business process simulation for virtual enterprises," e-Business Engineering, 2005. ICEBE 2005. IEEE International Conference on , vol., no., pp.87-92, 12-18 Oct. 2005
doi: 10.1109/ICEBE.2005.24
URL:http://ieeexplore.ieee.org/stamp/stamp.jsp?tp=&arnumber=1552874&isnumber=33062
20. Chiniforooshan Esfahani, Hesam; Cabot, Jordi; Yu, Eric; , "Adopting agile methods: Can goal-oriented social modeling help?,"
Research Challenges in Information Science (RCIS), 2010 Fourth
International Conference on , vol., no., pp.223-234, 19-21 May 2010
doi: 10.1109/RCIS.2010.5507382
URL:http://ieeexplore.ieee.org/stamp/stamp.jsp?tp=&arnumber=5507382&isnumber=5507122
21. Kruchten, P. (2000). The rational unified process: A introduction. Addison-Wesley object technology series. Reading,MA: Addison-Wesley.
22. Kroll, P. & Kruchten, P., (2003), The Rational Unified Process Made Easy: A Practitioner's Guide to the RUP. Addison-Wesley, Boston.