-
Information Systems College of Business Administration University of Missouri - St. Louis Information Systems Analysis
CASE Tool Information
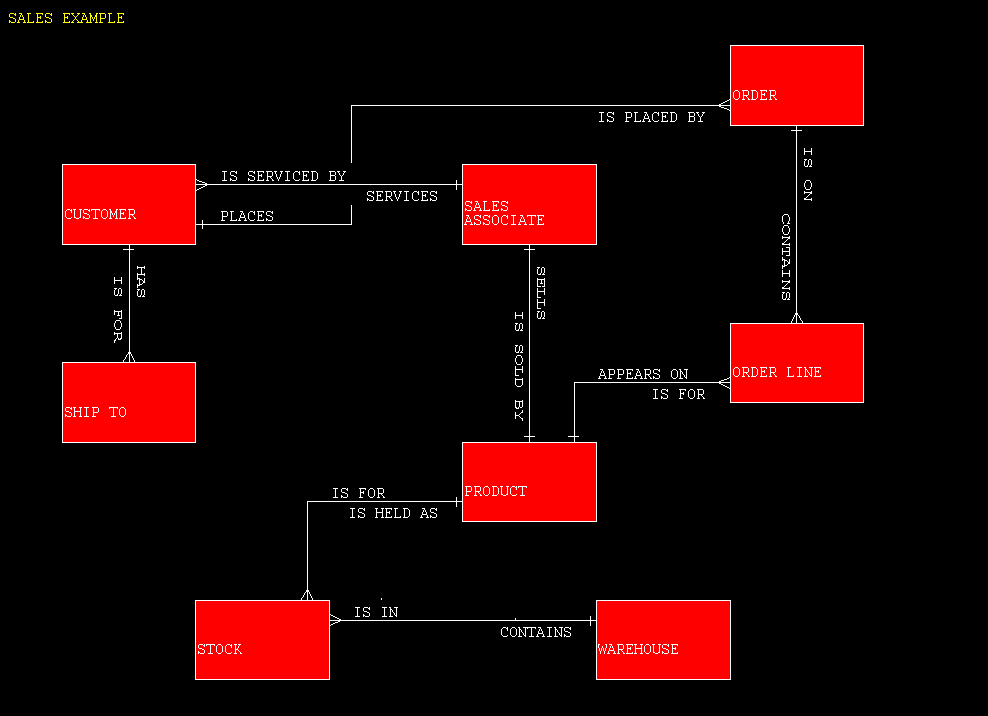
The examples we will use are for orders. The first Entity-Relationship Diagram (the basic one) shows orders, customers, sales associates, products, stock and the warehouse.
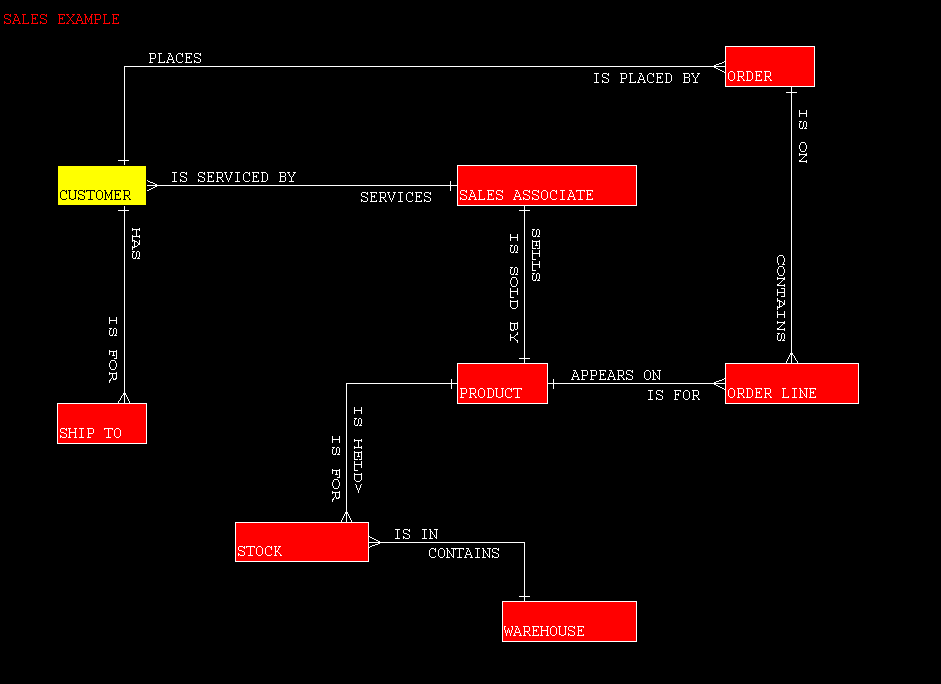
The second E-R Diagram illustrates IEF's abilty to size and move entities.
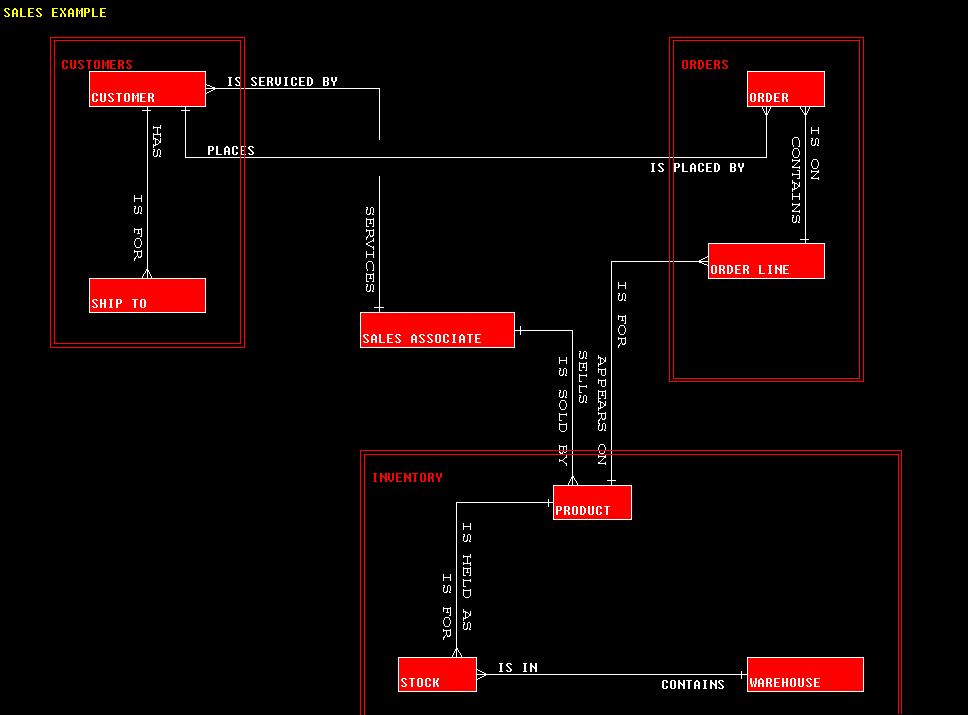
The third E-R Diagram illustrates IEF's ability to group entities into subject areas.
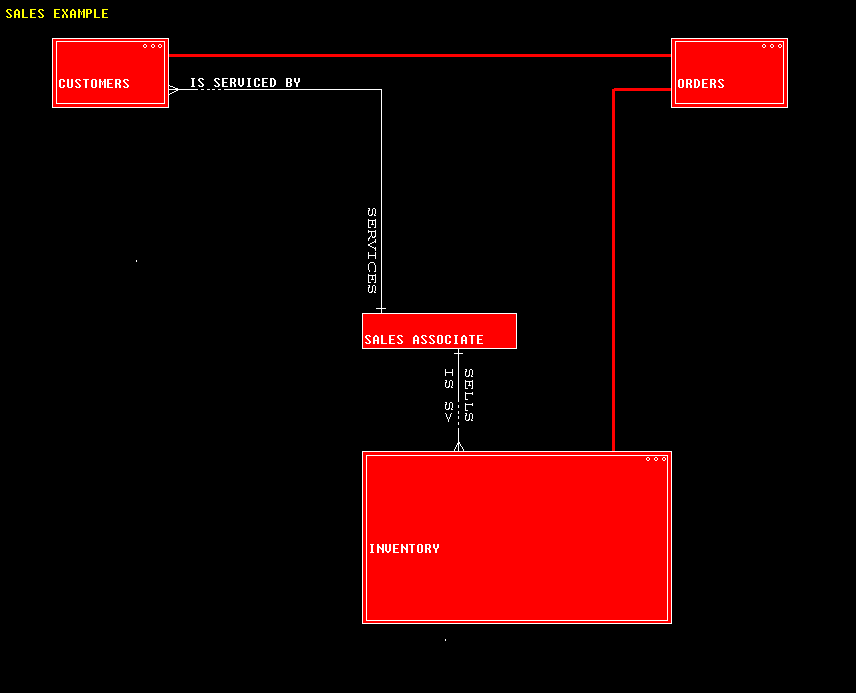
And, of course, you could hide the entities and only show the groups as shown in the fourth diagram.
You can also look at the data model as a tree.
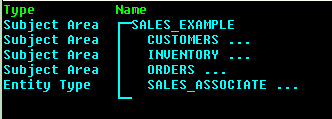
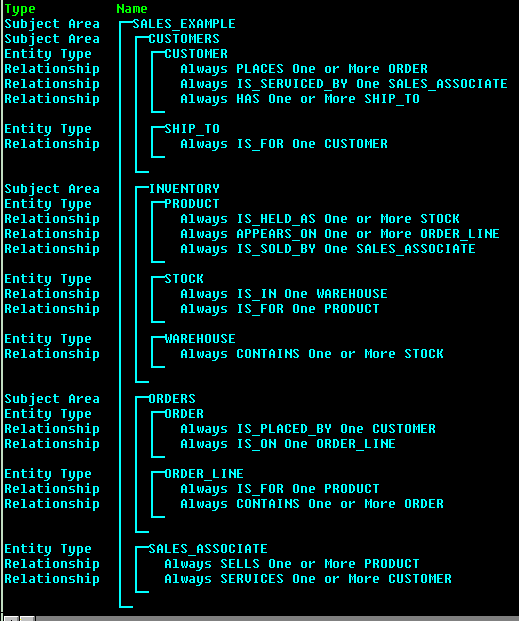
You can expand the tree to see all entities as shown below.
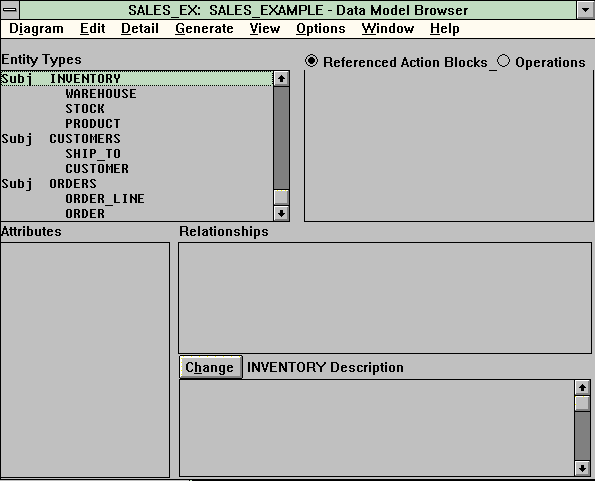
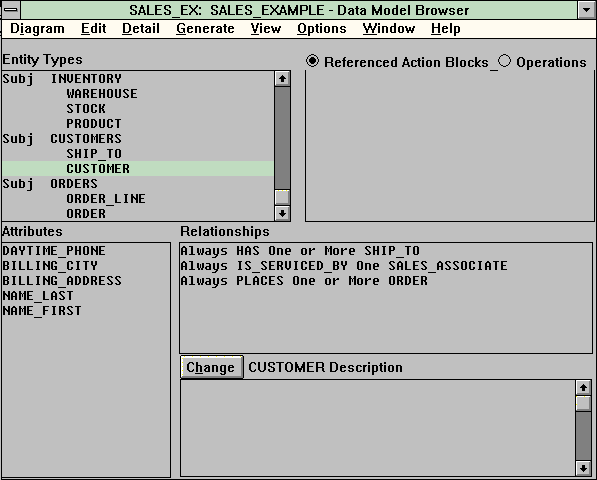
Finally, you can use the data model browser to look more deeply into the data model.
With greater depth, the model appears as below.
| UM-St. Louis Home Page | College of Business Page | IS Home Page | Analysis Current Page |