Comparison of Diagramming Tools
Prepared by
Thanakorn Nitakorn
Information System Analysis
Table of Contents
1.
Introduction
2.
Flowchart
a.
Why flowchart is not popular in system analysis
b.
Flowchart components
3.
Data Flow Diagrams (DFDs)
a.
Data Flow Diagram Components
b.
Rules of Drawing Data Flow Diagram
c.
Data Flow Diagram Levels
4.
Use Case Diagram
a.
Use Case Diagram Components
b.
Use Case Relationships
5.
Entity-Relationship Diagrams
a.
Entity-Relationship Components
6.
State-Transition Diagram
a.
State-Transition Diagram Components
7.
Comparison of diagrams
8.
Conclusion
9.
Footnote
Introduction
The diagrams described in this
document are Control Flow diagrams (Flowcharts), Data Flow Diagram, Use Case
Diagram, Entity-Relationship Diagram, and State-Transition Diagram. Activities
in each diagram are mentioned briefly. Most of these diagrams have several
steps/processes/objects. After explain you briefly details in each diagram, I
then compare the diagrams in term of the purpose of each diagram in the system
analysis. Finally, I then summarized the briefly details of diagrams and how
system analysts or users applied it into the analysis of real system.
Flowchart
Flowchart is the schematic representation of a process.[1] It
is the earliest and best known diagramming tools. It is also known as Control
flow diagram. Flowchart allows users to graphically view the process and also
helps them including audiences easily understand the content and easily find
flaws in the process. It breaks a process down to a finite number of steps that
get executed one at a time. Thus, if the flowcharts accurately describe the
content carried out within them in the diagram, they can be used for analysis.
It actually does not say anything about what the inputs and outputs of each
step are. It does not address how each step performs internally.[7] Flowchart can be used by systems analysts in
order to document process specifications.
Flowcharts will be the useful
diagramming tools for the system analysis activity when it is concerned with
the user implementation. The users, the system analysts and the implementation
team can discuss those implementation constraints that must be imposed upon the
system. They, for example, can determine the boundary of the system and the
details of the interaction between the systems and the users.
Why flowchart is not
popular in system analysis
However, there are several reasons
that most system analysts actually do not use detailed flowcharts for process
specifications.[2]
- Flowcharts
can be difficult to read and complicated. Using flowcharts required users
to deeply understand the systems and frequently modified the flowcharts to
the simpler way.
- Flowcharts
will be the time consuming and tedious to redraw the flowchart each time
because it requires system analysts to redraw it whenever the detailed
policy changes.
- New
diagramming method such as Data Flow Diagrams are more effective way to
illustrate a multidimensional reality.
Flowchart components
Flowcharts are composed of many
symbols but the common flowcharts are composed of three basic symbols: Arrows,
Diamonds and Rectangles.
- Arrows represent flow of control. It
must be draw from one symbol and end at another symbol.
- Diamonds represent decision points.
Typically, it contains a Yes/No or True/False question and requires two
Arrows coming out of it to support the decision. Nevertheless, it is
possible that there are more than two Arrows coming out of it. In that
case, it will be the clear indicator of the complex decision and it is usually
required to be broken down.
- Rectangles represent tasks or activities
that occur in the processes.
Flowcharts may also contain other
symbols such as page connectors when your diagram is too big to fit in one
page, input/output which is represented by parallelogram and etc.
Unlike Data Flow Diagrams which are
used to describe data flow within the system, flow charts are typically used to
describe the detailed logic of a business process or business rule.[3]

Figure 1: The example of the Flow
Chart.[17]
Data Flow Diagrams (DFDs)
Data flow diagram is a graphical representation of the flow of data
through an information system.[4] It is one of the most commonly used
systems-modeling tools, particularly in the operational system in which
functions of the system are the most important and more complex than the data
that the system manipulates. Rather than showing the strict order of execution
of steps, it shows how processes depend on one another for information.[7] It shows data flow from external into the system and shows
how the data moved from one process to another process. Data flow diagrams are
one of the three essential perspectives of Structured Systems Analysis and
Design Method (SSADM).
System analysts use it as a tool for
modeling and analyzing the processes in the system. It helps analysts to
visualize the data processes since data enter to the system, and then they are
used by the system until they are returned to the environment. Analysts also
use DFDs to study alternative information handling procedures during the
process of designing new information services. In addition, Data Flow Diagrams
can be used for compared the new system and the old system. With this
comparison, system analysts can find the gap between two systems and the
effectiveness of the improved system.
Although Data Flow Diagram is one of
the power tools for analyzing the systems, the system analysts must keep in
mind that it provides only one view of the system. It focuses mainly on the
function-oriented view. So, if the systems are more concerned with data
relationships than the functions, Data Flow Diagram will be less important.
Instead, system analysts must concentrate mainly on developing the
Entity-Relationship Diagrams. Alternatively, the State-Transition Diagrams will
be the most importance if the time-dependent behavior of the system dominated
all other issues.
Data Flow Diagram
Components
A data flow diagram illustrates the
processes, data stores, and external entities in a business or other system and
the connecting data flows.[4] There are only four symbols for
a data flow diagram: Squares or Ovals, Circle or Rounded Rectangles, Arrows,
and Open-ended Rectangles.
- Squares or Ovals represent external entities,
terminators, sources, or sinks. Typically, a terminator is a person or a
group of people outside the control of the system being modeled. It
represents where information comes from and where it goes. There are three
important things that we must remember about terminators:[5]
- They
must be outside the system we are being modeled.
- As
a result, neither the system analysts nor system designers are able to
change the contents, organization and the internal process within the
terminators.
- Any
relationship between each terminator is not a part of the system we are
considering, so the system analysts and designers can not include any
relationship that exists between terminators. Thus, in case there are
relationships occur between terminators and those relationships are
important for system analysts to model a proper system, the terminators
are actually part of the system and system analysts should include it as
processes in data flow diagram, not terminators.
- Circles or Rounded Rectangles represent processes within the
system. It shows a part of the system that transforms inputs into outputs.
The name of the process in the symbols usually explains what the process
does so that it is generally used with verb-object phase. In some cases,
however, the process may contain the name of the person or group of
people, or a mechanical device. So, it sometimes tells us who or what is
carrying out the process, rather than describing what the process is.
- Arrows represent the data flows. It
can be either be electronic data or physical items or both. The name of
the arrows represents the meaning of the packet (data or items) that flow
along. In addition, like Arrows in flow charts, Arrows in data flow
diagrams show direction to indicate whether data or items are moving out
or into a process.
- Open-ended Rectangles represent data stores,
including both electronic stores and physical stores. Data stores might be
used for accumulating data for a long or short period of times.
Nonetheless, the data flow diagram
doesn’t answer a lot of procedural questions that you might have when looking
at the DFD.[5] All the questions related to procedural
details are normally modeled within Flowcharts or other procedural modeling
tools. Some examples of the procedural questions are what the criteria for
moving data from one process to another process and what the order in which the
processes are performed.
Rules of Drawing Data Flow
Diagram
Furthermore, there are several common
modeling rules that you need to follow when creating Data Flow Diagrams.[6]
- At
least one data flow in and one data flow out is required to each process
in the system.
- The
data output for each process should be modified from the data input. So,
the outgoing data should be in the new forms.
- Each
data store must be involved with at least one data flow.
- Each
external entity must be involved with at least one data flow.
- A
data flow must be attached to at least one process.
- A
data flow can be moved in one direction only.
- A
data flow can not be returned to the process from which it originated.
- Both
branches of a joined data flow must have the same data type.
Data Flow Diagram Levels
In the real projects, data flow
diagrams are considerably large and complex. So we need to avoid drawing the
whole system in only one diagram. System analysts organize the overall DFD in a
series of levels so that each level provides successively more detail about a
portion of the level above it.[5] The top-level DFD is called
a context
diagram which represents the system as a single process. It consists
of only one circle representing the entire system, the data flows showing the
interaction between the system and the external terminators. There is no data
stores appear on a context diagram because the data stores of the systems are
conceptually inside the one process. The context diagrams are useful for
showing how a proposed system may behave for a specific example or scenario.
The next level DFD are called Level-0 DFD, Level-1 DFD, and so on. Level-0
diagram is the decomposition of the one process from the context diagram into
two to nine high-level processes. Then, each process in the Level-0 diagram can
be decomposed into the next level.
In order to properly create many
levels of data flow diagram, you must understand two concepts: decomposition
and balancing.
- Decomposition
is the iterative process by which system description has been broken down
into deeper detail. One process on a given diagram is then explained in
greater detail on a lower-level diagram.
- Balancing
is the conservation of inputs and outputs to a data flow diagram process
when that process is decomposed into a lower level.
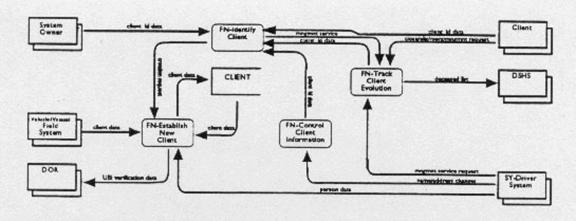
Figure 2: The example of the Data
Flow Diagram.[18]
Use Case Diagram
In the Unified Modeling Language
(UML), a use case diagram is a sub class of behavioral diagrams.[8]
Use Case Diagram is one of the Object Oriented Diagrams. It shows how a system
interacts with the external entities. So, it is relatively sparse about the
details of how the system behaves internally and how the external environment
is configured. Indeed, Use Case Diagram shows what we want the system to do
rather than describe how it can be accomplished. One of the major benefits of
this diagram is communication.
Use Case Diagram
Components
There are four major symbols in the
Use Case Diagrams: Use cases, Actors, and Associations and System boundary.
·
Use Cases describe a sequence of actions.
Those actions must provide the measurable value to an actor. It is represented
by horizontal ellipse.
·
Actors are a person, group of people,
organization, or external system the plays a role in one or more interactions
with your system. Furthermore, it can be networks, communication devices,
computers, or other programs on the same computer. It is represented by stick
figure.
·
Associations or Communications indicate the interaction described
by a use case. It is represented by lines connecting between use cases and
actors with an optional arrowhead on one end of the line. Notice that the
arrowheads in Use Case diagram is used for indicating the direction of the
initial invocation of the relationship or to indicate the primary actor, while
the arrowheads of Data Flow Diagram is used for showing the flow of data in the
system.
·
System boundary is the rectangle around the use
cases. Anything within this boundary is the functionality in scope of the
system.
System analysts and designers must
remember that interaction among actors is not shown in the Use Case Diagrams.
Thus, the system boundary should reexamine if the interaction between actors is
essential to a coherent description of the desired behavior. Furthermore,
Actors are formed based on the role we set. So, the different actors may
actually be the same person.
Use Case Relationships
There are three major types of Use
Case Relationships: Include Extend, and Generalization or Inheritance.
- Include relationship occurs when the first use case
depends on the outcome of the included use case. It is helpful when the
same use case can be factored out of two different use cases. For example,
when patient (actor) wants to make appointment (use case). It is required
that make appointment depends on check patient record (included use case).
You may refer Include relationships as the equivalent of a procedure call.[9]
- Extend relationship indicates that the behavior of
extension use case may be inserted in the extended use case under some
conditions. For instance, patient (actor) is linked to Pay Bill (extension
use case). Whenever the patient is required more treatment, the extend
relationship emerges between Pay Bill (extension use case) and Defer
Payment (extended use case).[10] You may refer Extend
relationships as the equivalent of a “hardware interrupt”.[9]
- Generalization or Inheritance indicates that a given use case
may be a specialized form of an existing use case. For example, Pay Bill
(parent use case) can be substituted by the Bill Insurance (child use
case) whenever necessary.

Figure 3: The example of the Use Case
Diagram.[19]
Entity-Relationship
Diagrams
Entity-Relationship Diagrams is a network
model that describes the stored data layout of a system at a high level of
abstraction.[11] For the system analyst, the benefit of using
Entity-Relationship Diagram is that it concentrates on the relationships
between data stores on the Data Flow Diagram that can be seen only in the
process specification. Since Data Flow Diagram mainly focuses on the function
that the system perform not the data that the system need, using
Entity-Relationship Diagram is important to capture another part of system
analysis which concentrates mainly on the data in the system.
Entity-Relationship
Components
There are four major components of an
Entity-Relationship Diagram: Objects or Entities, Relationships, Associative
object type indicators, and Supertype/Subtype indicators.
· Entities represent set of objects in the real
world. Entities are represented by rectangles. It has three main
characteristics. First, each entity can
be identified uniquely in some way. Student, for example, must be able to
distinguish from one another by student identities, or name because if students
are the same, then Student is meaningless in Entity-Relationship Diagram.
Second, each entity must play a necessary role in the system. In other words,
objects which have no role in the system can not put into the system. Third,
each entity can be described by one or more data elements. For instance,
Textbook can be described by one attribute or one data element, ISBN. Also, it
can be described by combined attributes (Title, Author, Published Date, and
Edition).
· Relationships represent set of connections between
entities. It captures how two or more entities are related to one another.
Diamond symbols are used for identify relationships. We must keep in mind that
the relationship represents something that must not be calculated or derived
mechanically by the system. Also, more than one relationship can occur between
objects.
· Associative object type indicator represents something that functions
both as an object and a relationship.
· Subtype/Supertype indicators represent objects and one or more
subcategories connected by a relationship. For example, Student can be
connected with Part-time Student and Full-time Student via unnamed
relationship. So in this case, Student is Supertype and Part-time Student and
Full-time Student are subtypes. Also, all data elements in supertype can be
applied to subtypes and subtype have additional data elements to identify
themselves.
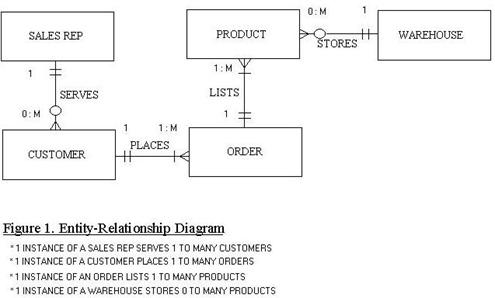
Figure 4: The example of the
Entity-Relationship Diagram.[20]
State-Transition Diagram
State-Transition Diagram (STD) is the
graphical representation of the system that created for dealing with the
time-dependent behavior of a system. Examples for the time-dependent systems are process control,
telephone switching systems, high-speed data acquisition systems, and military
command and control systems.[13] However, if the system is
dealing with inputs from many terminals or high-speed inputs from other
systems, then it may have the same kind of time-dependent issues. So, system
analysts must be familiar with this modeling tool.
State-Transition Diagram
Components
There are two major components for
this diagram: States, Changes of State, and Conditions and Actions.
·
System States
are represented by rectangles. States are the sets of circumstances or
attributes characterizing a person or thing at a given time. Keep in mind that
States are something in the system that waiting for something from external
environment to occur or waiting for a current activity in the environment to
change to some other activity.
·
Changes of State is shown by the arrows. It represents the change from one state to
another by connecting the relevant pair of states. Note that a system can have
only one initial state but can have multiple final states.
·
Conditions and Actions are shown next to the arrow connecting two related states.
Condition explains the cause of changing the state and Action explain what the
system takes when it changes state. Remember that condition is some event in
the external environment that the system is capable of detecting, not the
change in the system.
Figure 5:
The example of the State Transition Diagram.[21]
Comparison of diagrams
Each diagramming tool is aimed at a
different portion of the analytical process.[16] Flow Charts
are useful tools when system analysts or users want to represent either the
processing or decision logic flows within the particular process, with its
associated inputs and outputs, or the flows of an entire system, with all the
various types of processing, preparation, inputs, outputs, data storage media,
and other hardware which are associated with it. Unlike Flow Charts, Data Flow
Diagram does not show the strict order of execution steps but it shows how
processes depend upon one another for information. Data Flow Diagram focuses
mainly on the functions performed by a system. One of the major benefits of a
Use Case Diagram is communication.[15] By looking at the Use
Cases, they know what functionality will be included in the system. Unlike Data
Flow Diagram, Entity-Relationship focuses entirely on the data relationships,
without providing any information about the functions that create or use the
data. State-Transition Diagram focuses mainly on the time-dependent behavior of
a system.
Each of these diagrams focuses on
critical aspect of the system we are modeling. It means that the person reading
the model is also focusing on one critical aspect. So, we should make sure that
we are drawing the diagram that is focused on that critical aspect. That is,
Data Flow Diagram focuses the reader’s attention on the functions in the
system. Entity-Relationship focuses on the data relationships and
State-Transition Diagram focuses on the timing characteristics of the
system.
Conclusion
Control flow diagrams or Flowchart
are the schematic representation of a process. They break a process down to a
finite number of steps that get executed one at a time.[7] It
does not focus on what the inputs and outputs are and also does not address why
we perform those process on each step. It just tells us about when the decision
is required in the system and what process step will be executed next based on
those decisions. Data Flow Diagram is a graphic representation of a
system. It consists of data flows, processes, sources, destinations and stores.
Unlike Flow Charts, Data Flow Diagram does not show the strict order of
execution steps but it shows how processes depend upon one another for information.
Use Case Diagram shows you some of the use cases in your system, some of the
actors in your system, and the relationships between them. It shows what we
want our system to do, but it does not explain the way how those requirements
can be accomplished. Entity-Relationship Diagrams is a network model that
describes the stored data layout of a system at a high level of abstraction. [11] Unlike Data Flow Diagram, it highlights relationships
between data stores on the Data Flow Diagram that can be seen only in the
process specification. The state-transition diagram is a powerful modeling tool
for describing the required behavior of real-time system.
Each diagram shows a different aspect
of some complex system. Any system of sufficient complexity can be derived from
different diagrams. System Analyst must realize that to successfully analysis
the systems, they need to understand the main information they got from each
diagramming tool. One diagramming tool may not enough for analyzing the system
and they may require using multiple diagrams.
Also, it is important to remember that diagrams are documentations. It
is a means of communication between groups of human beings and needs to be
understandable to both senders and receivers.[7]
What diagrams need to be develop
depend on the kind of system you are developing. For example, if the system you
are analyzing has complex functions but relatively trivial data structures,
Data Flow Diagram will be the best tool. However, in many cases of the real
systems, they are required that system analysts must be dealing with more than
one diagramming tools.
Footnote
[1] Flowchart, http://en.wikipedia.org/wiki/Flowchart,
Last modified November 09, 2006.
[2] Ed Yourdon – Just Enough Structured Analysis – Chapter15, http://www.yourdon.com/strucanalysis/chapters/ch15.html,
Last accessed November 15, 2006.
[3] Introduction to Flow Charts, http://www.agilemodeling.com/artifacts/flowChart.htm,
Last updated April 03, 2006.
[4] Data flow diagram, http://en.wikipedia.org/wiki/Data_flow_diagram,
Last modified November 13, 2006.
[5] Ed Yourdon – Just Enough Structured Analysis – Chapter 9, http://www.yourdon.com/strucanalysis/chapters/ch9.html,
Last accessed November 15, 2006.
[6] Introduction to Data Flow Diagram, http://www.agilemodeling.com/artifacts/dataFlowDiagram.htm,
Last updated April 03, 2006.
[7] System Diagram Essentials, http://www.jwrider.com/lib/DiagramEssentials.htm,
Last accessed November 16, 2006.
[8] Use case diagram, http://en.wikipedia.org/wiki/Use_case_diagram,
Last modified November 20, 2006.
[9] Introduction to UML 2 Use Case Diagram, http://www.agilemodeling.com/artifacts/useCaseDiagram.htm,
Last updated April 03, 2006.
[10] Digging Deeper: Use Case Diagrams, http://bdn.borland.com/article/31863,
Last accessed November 16, 2006.
[11] Ed Yourdon – Just Enough Structured Analysis – Chapter 12, http://www.yourdon.com/strucanalysis/chapters/ch12.html,
Last accessed November 16, 2006.
[12] Entity-relationship model, http://en.wikipedia.org/wiki/Entity-relationship_model,
Last modified November 10, 2006.
[13] Ed Yourdon – Just Enough Structured Analysis – Chapter 13, http://www.yourdon.com/strucanalysis/chapters/ch13.html,
Last accessed November 16, 2006.
[14] What is SSADM?, http://www.webopedia.com/TERM/S/SSADM.html,
Last modified February 19, 2003.
[15] Use case Vs. Dataflow diagrams, http://www.laynetworks.com/use%20case%20vs.%20dataflow%20diagram.htm,
Last accessed November 16, 2006.
[16] Modeling and Diagramming Techniques, http://www.martymodell.com/pgsa2/index.html,
Last accessed November 20, 2006.
[17] Flow Charts, http://deming.eng.clemson.edu/pub/tutorials/qctools/flowm.htm,
Last accessed November 20, 2006.
[18] Data Flow Diagram, http://jin.wa.gov/standards/justiceCommonArchitecture/data.htm,
Last accessed November 20, 2006.
[19] ConceptDraw WebWave Samples: Web-Site Structure Design, http://www.conceptdraw.com/products/img/ScreenShots/cd5/uml/UML_Use-case-diagram.gif,
Last accessed November 22, 2006.
[20] Entity-relationship Diagram, http://searchcrm.techtarget.com/sDefinition/0,290660,sid11_gci333128,00.html,
Last accessed November 22, 2006.
[21] The State Transition Diagram, http://www.csc.calpoly.edu/~dbutler/tutorials/winter96/rose/node10.html,
Last accessed November 22, 2006.
Non-web Citations
[1] Modern Systems Analysis and Design,
[2] Flow Chart, First Edition, John Ashbery, ISBN: 0679402012.
[3] Structured analysis and system specification, Tom
DeMarco, ISBN: 0138543801
[4] Fundamentals of Database Systems,
[5] Database Systems: Design, Implementation, and Management,
Sixth Edition, Rob and Coronel.
[6] Learning SQL, First Edition, Alan Beaulieu, ISBN:
0596007272.
[7] The unified modeling language, Jean Bézivin, Pierre-Alain
Muller, ISBN: 3540662529
[8] Modern structured analysis, Edward Yourdon, ISBN:
0135986249
[9] Use Case Modeling - Page 28, Kurt Bittner, and Ian
Spence, ISBN 0201709139
[10] Technical Data Requirements for Systems Engineering and
Support, Thomas F. Walton, ISBN: 0138968780
[11] Analyzing Business Information Systems: An
Object-Oriented Approach, Shouhong Wang, ISBN: 0849392403