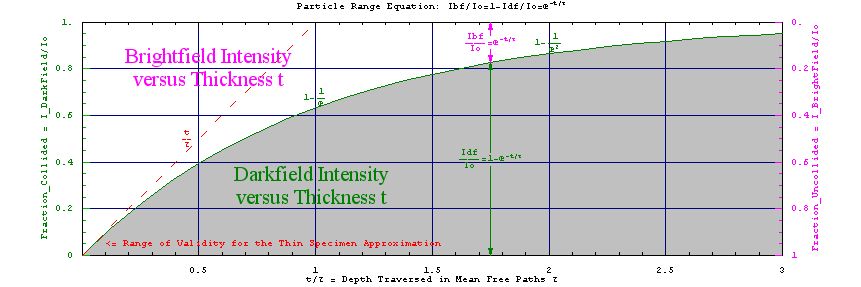
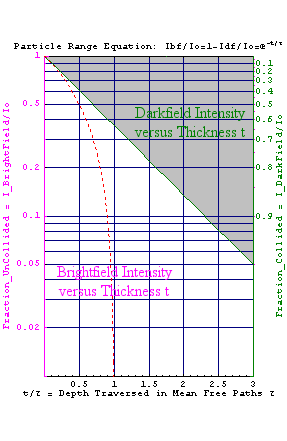
Below we plot the range equation for both darkfield (scattered particle) and brightfield (unscattered particle) intensities, namely IBF/Io=1-IDF/Io=e-t/τ, as a function of specimen thickness t over mean free path τ. In the thin specimen limit this goes to 1-t/τ. Versions of this equation are used to parameterize electron scattering experiments from single atoms and from thin specimens in the sections below. Solving for specimen thickness t, one gets t/τ=Ln[Io/IBF]~1-IBF/Io. A small semi-log version of the plot below, with BF and DF exchanged so the profile becomes a straight line, is linked here.
The equation above is predicated on the idea of only one scattering process removing particles from unscattered (brightfield) to scattered (darkfield) status as a function of depth. Different scattering processes (e.g. detector solid angles) will involve different cross-sections. If your data supports more than one fitting parameter, even more sophisticated models will likely help.
Below you'll find listed a more specific set of range equations, followed by their thin specimen approximations...
IBFcarbon/IBFo = Exp[-t/τBFcarbon] ~ 1 - t/τBFcarbon.
IDFcarbon/IDFo = 1 - Exp[-t/τDFcarbon] ~ t/τDFcarbon.
IDFatoms/IDFo = 1 - Exp[-NatomsZ1.7fH] ~ NatomsZ1.7fH.
The foregoing equations define model quantities, and their relationships, for a set of semi-empirical parameters to be used in analyzing experimental images.
Combining values measured from real specimens (denoted with a prime) for I'BFcarbon/I'BFo, I'DFcarbon, and I'DFatoms with model values for τBFcarbon, τDFcarbon, and fH (e.g. from Kirkland simulations taylored to the microscope and specimen actually used), the protocol below combines data from experimental brightfield and darkfield images, with simulations of images from model specimens, to estimate the Z-value of single heavy atoms in a specimen of disordered carbon. Here I'BFcarbon/I'BFo is the ratio between specimen and hole intensities in a STEM brightfield image, while I'DFcarbon is the intensity of the same specimen region in a concurrent HAADF image. I'DFatoms is the background subtracted darkfield intensity (value in the center pixel) when the beam is centered on a single heavy atom. The model quantities are calculated using simulations with specimens and microscope settings as close as possible to those actually involved.
|
Information Source
|
Quantity
|
Example
|
|
BF-STEM Simulation
|
Infer τBFcarbon from simulated images of
a carbon model specimen of known density and thickness, i.e.
τBFcarbon ~ t/Ln[IBFo/IBFcarbon].
|
Ā τBFcarbon~1.5μm. |
|
Experimental BF-STEM Image of Carbon
|
Use the foregoing to esimate the thickness t'carbon
of carbon in an experimental brightfield image, i.e.
t'carbon ~ τBFcarbonLn[I'BFo/I'BFcarbon].
|
Ā t'carbon~80Å |
|
ADF-STEM Simulation
|
Infer τDFcarbon from simulated darkfield images
of the carbon model specimen mentioned above, i.e.
τDFcarbon ~ t/Ln[IDFo/IDFcarbon].
|
Ā τDFcarbon~... |
|
Experimental ADF-STEM Image of Carbon
|
Use the inferences above to estimate the
incident beam intensity in IDFo, in
units of IDFcarbon, for an experimental
darkfield image taken at the same time as the
brightfield image above.
|
Ā IDFo~... |
|
ADF-STEM AtomSim
|
Estimate an effective scattering fraction fH for
scattering by a hydrogen atom into the darkfield aperture, using simple
scaling laws and a model atom near in Z to the one being
investigated.
|
Ā fH~... |
|
Experimental ADF-STEM Image of Atoms
|
Finally, from the above estimate Zatom given
the intensity (relative to scattering from the carbon) of a single
heavy atom in the original experimental image.
|
Ā Zatom~... |