

play the am2.wav file --\\ //----- play the fm2.wav file
To warm up, consider harmonic analysis of sounds (at 448 Hz on the high side of a 440 Hz concert A), each held for two seconds. One is amplitude modulated at 6 cycles per second, while the other is frequency modulated at the same rate. Can you tell the difference between the two from the frequency-time plots below? How would you describe the way they differ to your ear? Which one would be more difficult to play on a clarinet?
An alternate form of amplitude modulation occurs when two instruments play almost but not quite the same note. In that case, beats are heard whose separation increases as the pitch difference decreases. This is an example in time of the phenomenon in space which gives rise to Moiré fringes between overlapping weaves, as well as the "reciprocal space" nature of diffraction. The colors in these harmonic analyses display pressure-wave phase-variations which we cannot hear, but which as you can see differ significantly according to the type of modulation. For example, the amplitude-modulation in the upper left shows constant phase (red color) from one maximum to the next, while the beats-modulation below shows phase reversals between zeros (indigo chartreuse indigo etc) which you may not be able to detect by ear.

Below find the frequencies in a song "lit up" as they vary with time. It almost looks like sheet music except that this type of analysis can be done for sound, not just standard notes. In other words if you are out of tune (for better or worse), it shows. As we try to illustrate here, harmonic analysis of periodicities in space (one, two and three dimensions) is quite useful as well.
Do the instruments playing the song have many harmonics? How would the analysis differ if the song was being played by a string quartet? What if there were voices accompanying the instruments? Can you recognize the song from its harmonic analysis alone?

By making the frequency scale logarithmic, as shown below one can even superpose readable treble and bass clefs on the song's harmonic analysis. Can you pick out those B-flats? Here are a piano roll, and a piano rendition, of the same passage for comparison. Stereo music may be displayed with color channels linked to specific instruments, microphones, or to oscillation phase, but black and white looks more like printed sheet music. In fact, one might marvel at traditional sheet music as an instance of log-f harmonic analysis evolved in parallel to the math and physical sciences approach described here.

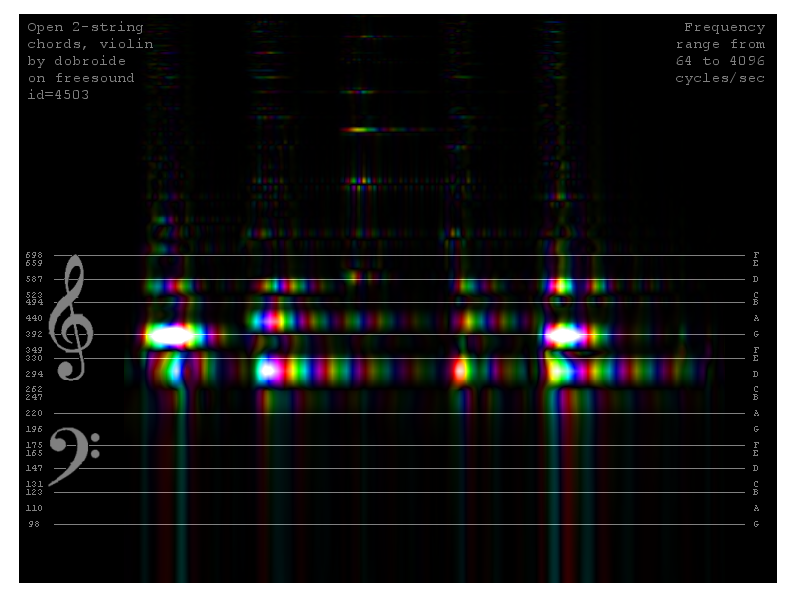
For a look at recorded sounds from an instrument with more harmonics, check out this complex-color plot of oscillation phase for a series of 2-string violin chords from this website. Can you figure out which bands are created by which string? Were the four strings (in sequence) tuned to G, D, A and E, or was one string only tuned a bit differently?
Compare the song harmonic analysis to the frequency analysis below, of an eleven word statement. The slanted white bands in this pattern, kind of like fingerprint whorls, track resonant frequencies in the speaker's voice box rather than notes played by an instrument. For example, when reciting the theatre voice exercise "woo, whoa, war, wow" you might notice in yourself a decrease in pitch as your voicebox relaxes over the course of each vowel. That's likely what we're seeing here.

Can you identify the species and gender and language of the speaker? What is being said? The visualization above might contain everything you need to answer these questions. Perhaps even the speaker's name is contained therein. Would a harmonic analysis of the appropriate alphabet come in handy here? Some of these questions might be easy to answer by just listening, but not all. For example, does the human voice normally relax to lower frequencies over the course of a typical vowel?
The same vocalization can also be displayed in log-frequency form, as shown below in color and here in black and white. The color below comes from from the periodicity phase of the pressure waves, something our ears cannot pick up but which is present in actual and recorded sounds nonetheless. This version of nature's sheet music thus suggests how to imitate a voice with a musical instrument, and shows that the spoken voice (as well as live music) can look (as well as sound) spectacular.

The web page linked here allows you to play with diffraction as a way to harmonically analyze the periodicities between atoms in a silicon crystal, like that which houses the computer logic now making it possible for you to read this message! On that webpage, the model on the left is a tiltable silicon crystal while the model on the right shows the diffraction pattern one gets according to how the silicon crystal is tilted.
The image below shows a pattern taken in the process of "industry fire-fighting" for a regional business that (since the 1950's) has made much of the silicon for the electronics industry. In this pattern, spatial frequencies run both left-right and up-down. Instead of cycles per unit time (e.g. Hertz running up-down in the sound analyses above), one has cycles per unit length running in both directions. Like this diffraction pattern, optical harmonic analyses often have an extremely wide range of contrasts in them. If you want to see more details, it may help to view them with dark-adapted eyes.

In the diffraction pattern above, for example, the distance between the unscattered beam or (000) spot, and the (220) spot, corresponds to a spatial frequency between planes of atoms in the silicon specimen of about 5.2 cycles per nanometer. The cool thing is that, by taking advantage of harmonic analysis, folks were able to measure these periodicities in crystals long before they could image the planes of atoms directly.