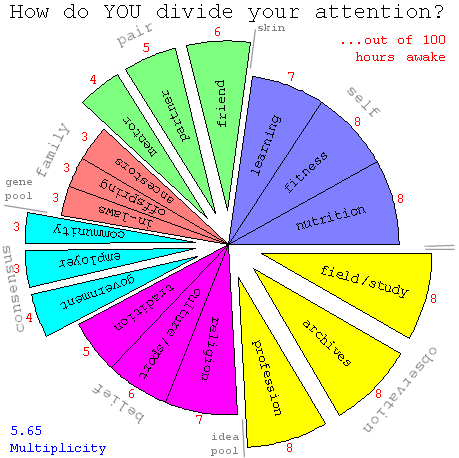
If you divide up your waking attention according to the scale of its focus inward or outward with respect to three physical boundaries (skin, gene-pool, and culture), an interesting way to display the result is in the spider-web format shown below. The displacement off-center of the black dot (the spider) denotes an individual's bias with respect to the various size scales, while the grey lines (the web) denote the portion of that individual's attention occupied with (and related to the strength of their focus on?) correlations on each of six levels. Objectively determining these numbers for a population of individuals is a separate story, alhough everyone can probably estimate how many of their last hundred hours involved a focus on self, friends, family, community/consensus, culture/belief, and profession/observation as shown below.
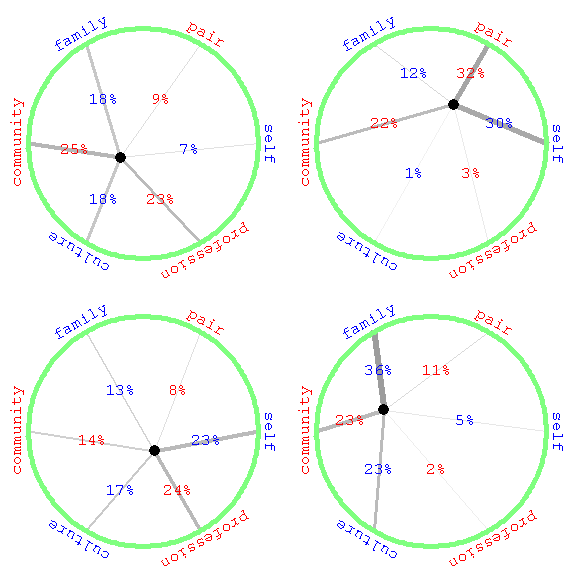
The color of the numbers reflects the emphasis on inward-looking (blue) versus outward-looking (red) foci. For example, although both plots below are balanced as far as scale of focus is concerned, the focus of the individual on the left below is relentlessly inward-looking with respect to skin, family, and culture, while the focus of the individual on the right is outward-looking instead. In that sense, these plots bring to mind the ancient distinction between yin and yang i.e. between nurturer and adventurer. They also suggest that perhaps we should give folks a break in today's world, if they are trying to be both nurturer and adventurer with respect to all three layers of organization at the same time!
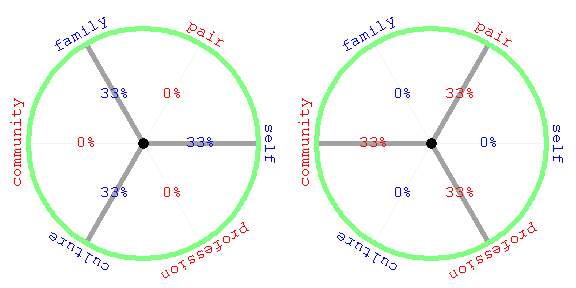
The plot at right below shows how a division of labor, e.g. between large-gamete (pastel) and small-gamete metazoans, can be used to reduce average layer-multiplicity Zavg while in principle keeping center-of-mass layer-multiplicity Zcm up near six. By helping organisms adapted for specific niches to develop their strengths, of course, such specialization could have its advantages as long as organisms remained aware of the complementary importance of all assignments.

On the other hand this particular yin-yang example taken to extremes will pull points over to the edges of triangles in projection, clearly leaving large blank spots open in the space of possible assignments. The effects of this could be made even worse if informed movement in assignment space was hindered, in the process of setting the division of labor up.
Thus the bias of individuals and groups with respect to nurture and adventure (e.g. sum of blue minus red numbers) could be fun to explore. More importantly, gathering the numbers above for a given community may be of deeply practical interest. First off, expression of codes informed to layers of organization on multiple scales in biological systems has been shown again and again to be crucial to both development and sustainability. Secondly, technical fields as diverse as thermodynamics, economics, anthropology, and the study of complex systems all suggest that a quantitative measure of community health may be of key importance in dealing with challenges that human communities face today and in the years ahead.
Applications might include quantifying the niche structure of any given metazoan community, along with the geographic distribution of its correlates. Such measures could serve as complement to GDP as human communities make the transition to sustainability on a finite planet, and as a yardstick for the impact of programmatic decisions as well as disasters. These measures should also help us to effectively and responsibly deconstruct extremist programs that disrespect correlations on one level or another.
Diverse fields of inquiry also suggest that as the connections between individuals and their communities on various scales are weakened (either by shortages or by policy decision), behaviors that ignore organization on one or more of these levels are likely to follow. Have you seen any of that lately? This sort of thing may be difficult to avoid on earth in the far future, as our sun moves toward the red giant branch, but letting it get the better of us now is worth trying to avoid.
Technical Note #001: It is useful to locate the equilibrium point (black dot) in the plots above by minimizing the weighted sum of squared distances between each hexagonal vertex (as one would a potential energy), or equivalently by setting the gradient (Hooke's Law force) to zero. For weights {p1,p2,p3,p4,p5,p6} that add up to Σp, this gives Cartesian coordinates for the equilibrium point of x=½(2p1+p2-p3-2p4-p5+p6) and y=½√3(p2+p3-p5-p6). These equations can also be used to locate hexagon vertex coordinates, on a circle of radius Σp, by setting all except one of the six weights to zero.
Technical Note #002: To give you a better idea of what these six numbers mean for an individual, as shown below you might break down that individual's attention focus for the last hundred hours. For interactive versions of these visualizations, check out java applets for the network circle discussed above, the attention slice pie shown below, and a 3-space dual tet representation of the 6-variable 5-simplex.